
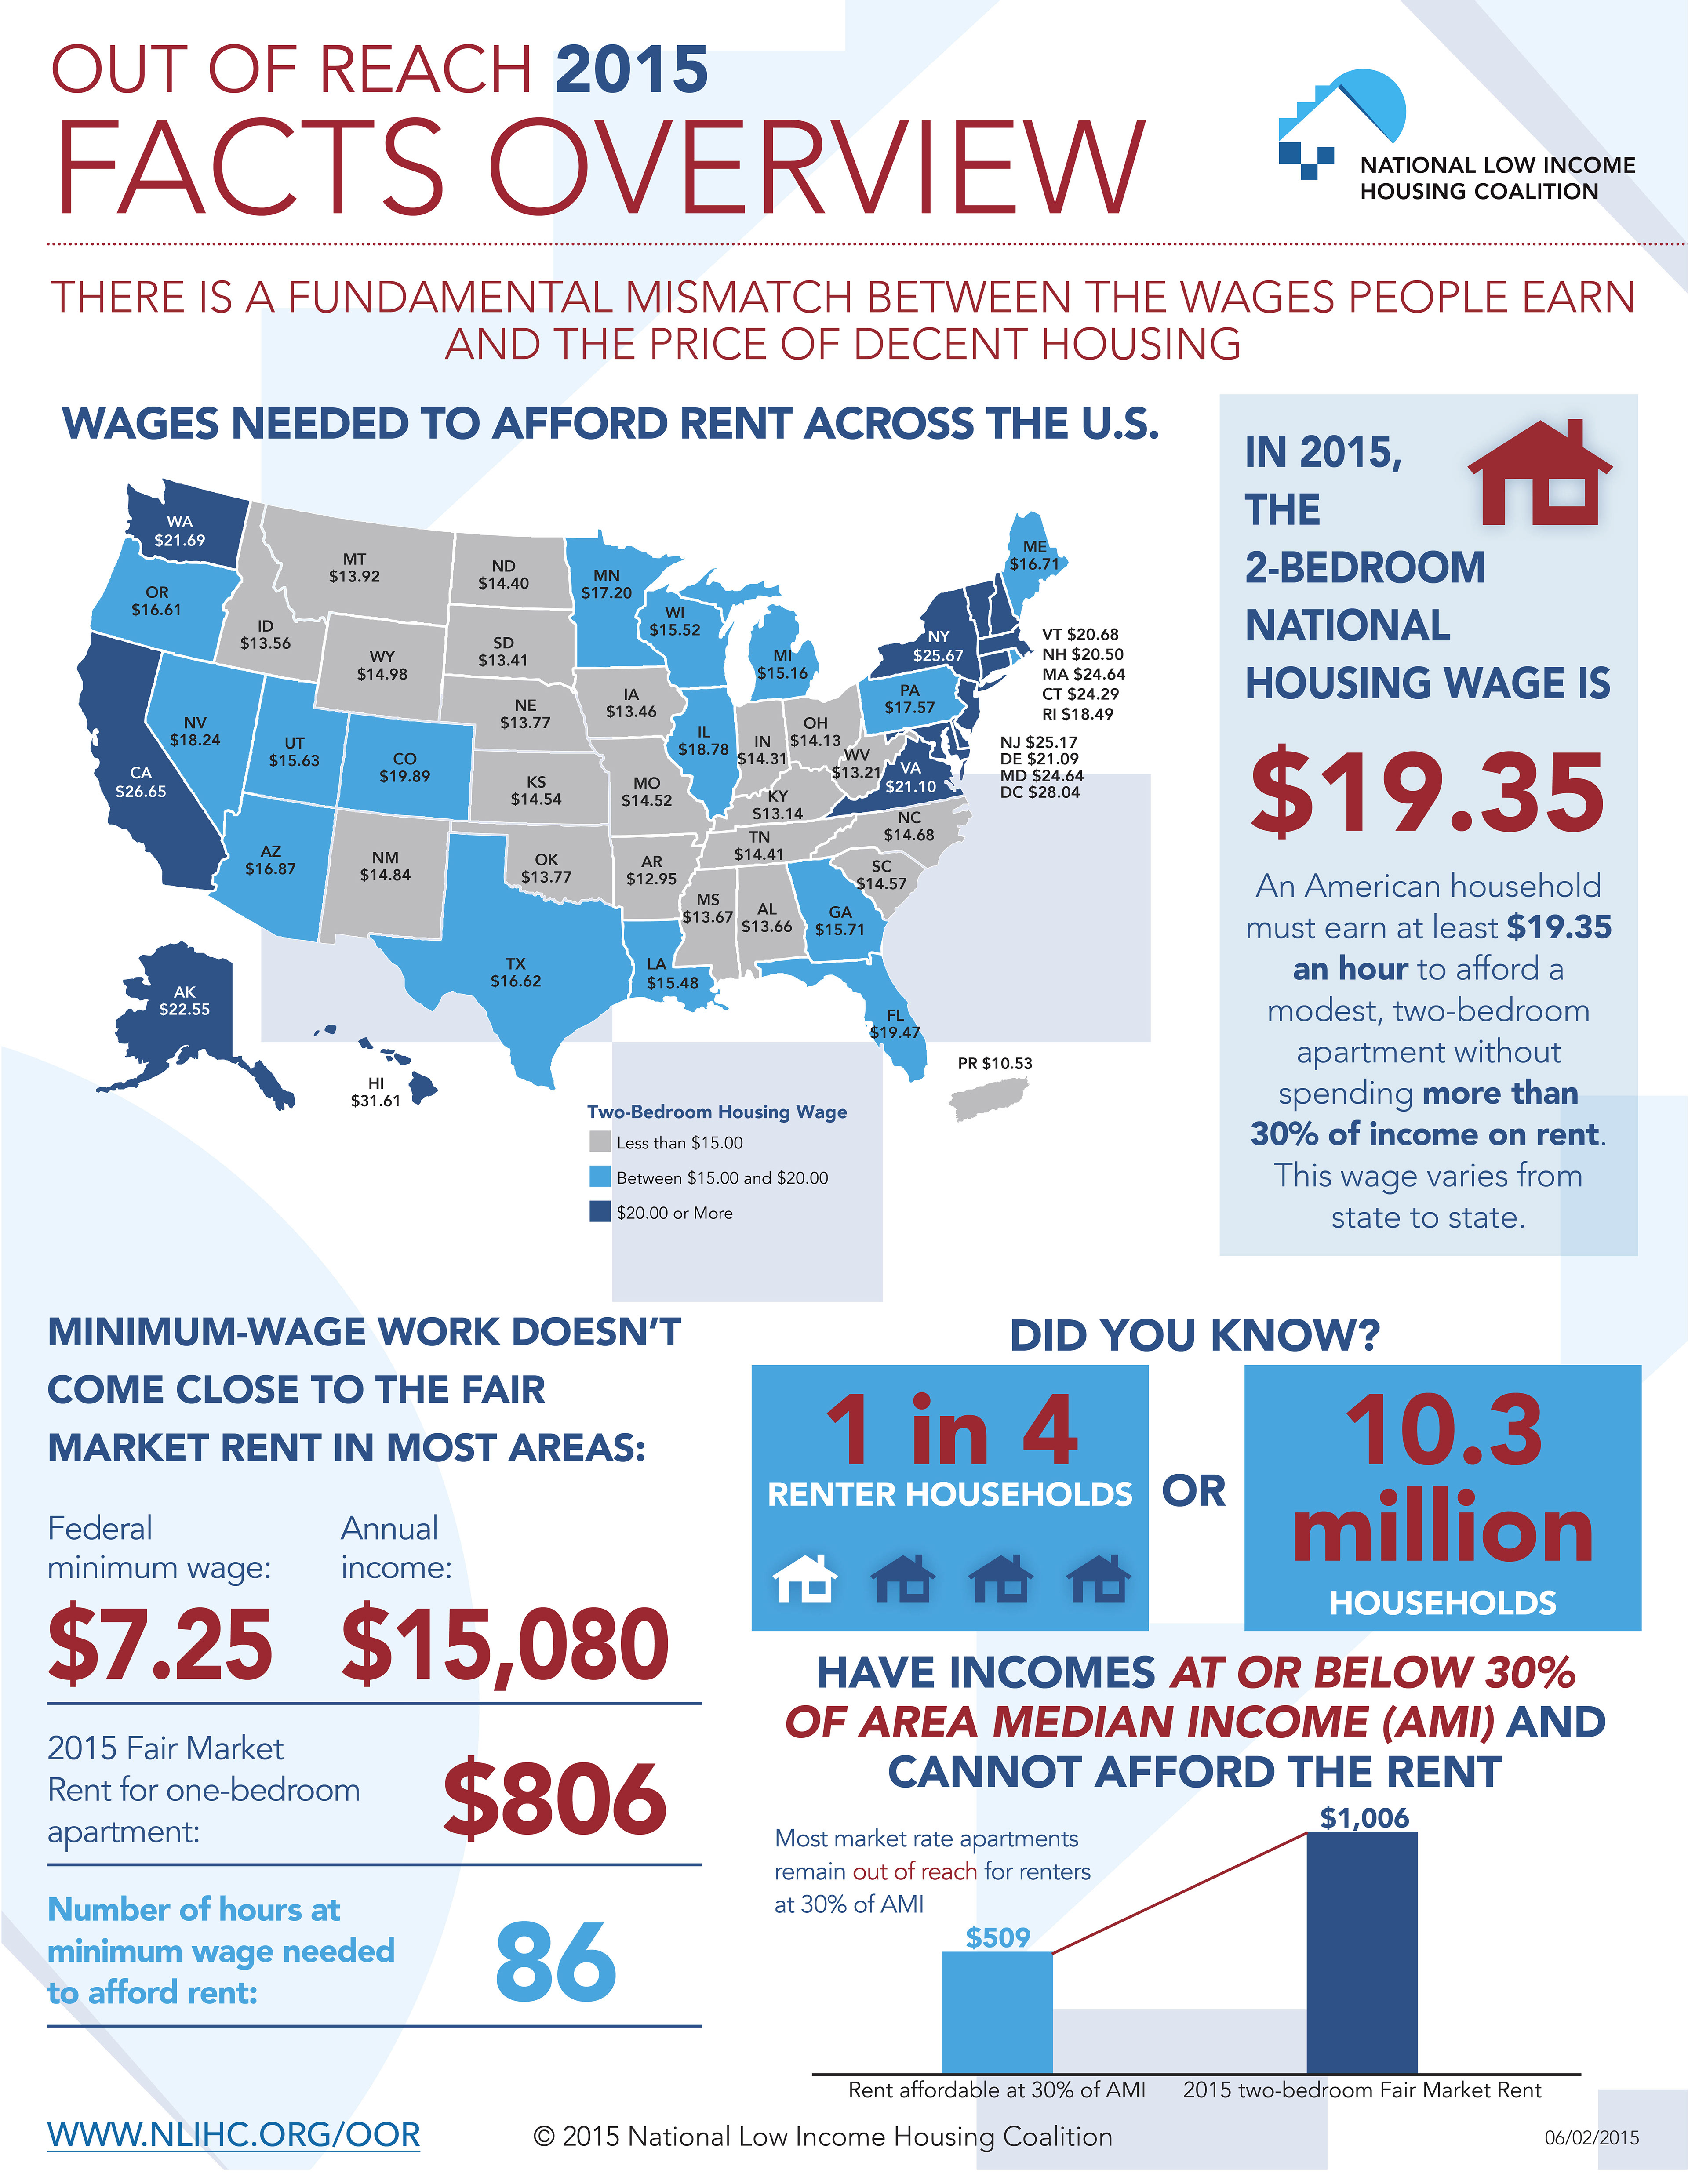
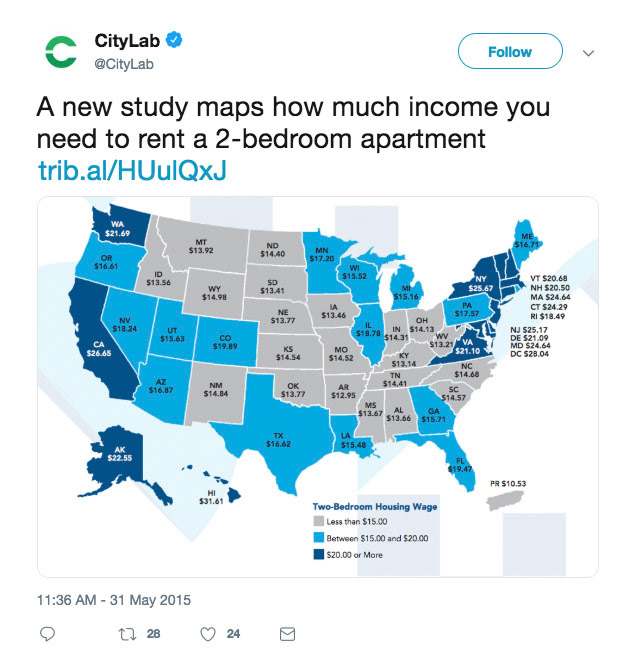
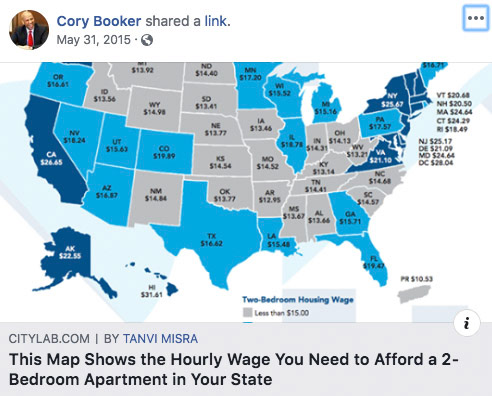
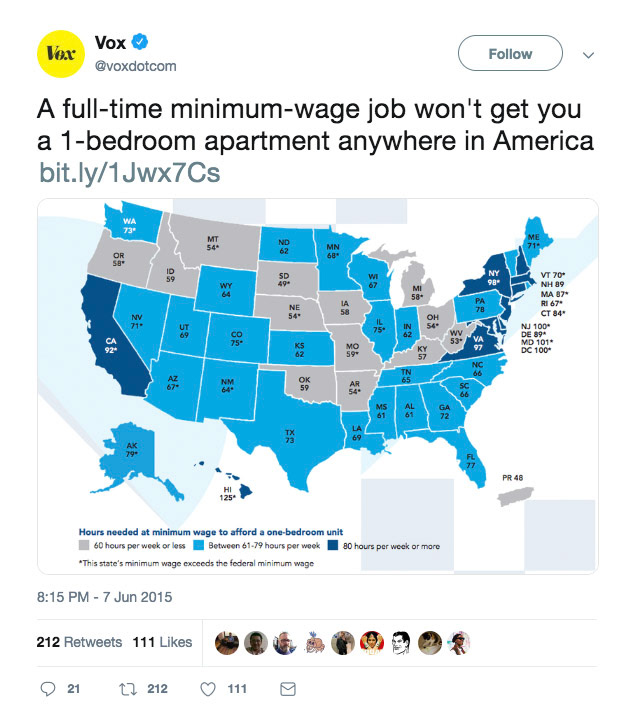
Out of Reach is NLIHC's flagship report that focuses on the yearly Housing Wage, which is the hourly wage a renter needs to earn to afford a 2-Bedroom Rental Unit at HUD's Fair Market Rent (FMR). Out of Reach over the years has gotten a lot of mentions in the Press and on Social Media, and has been featured in major news outlets such as the Washington Post, Huffington Post, Chicago Tribune, Yahoo! News, Atlantic Citylab, CBS News, and U.S. News and World Report.
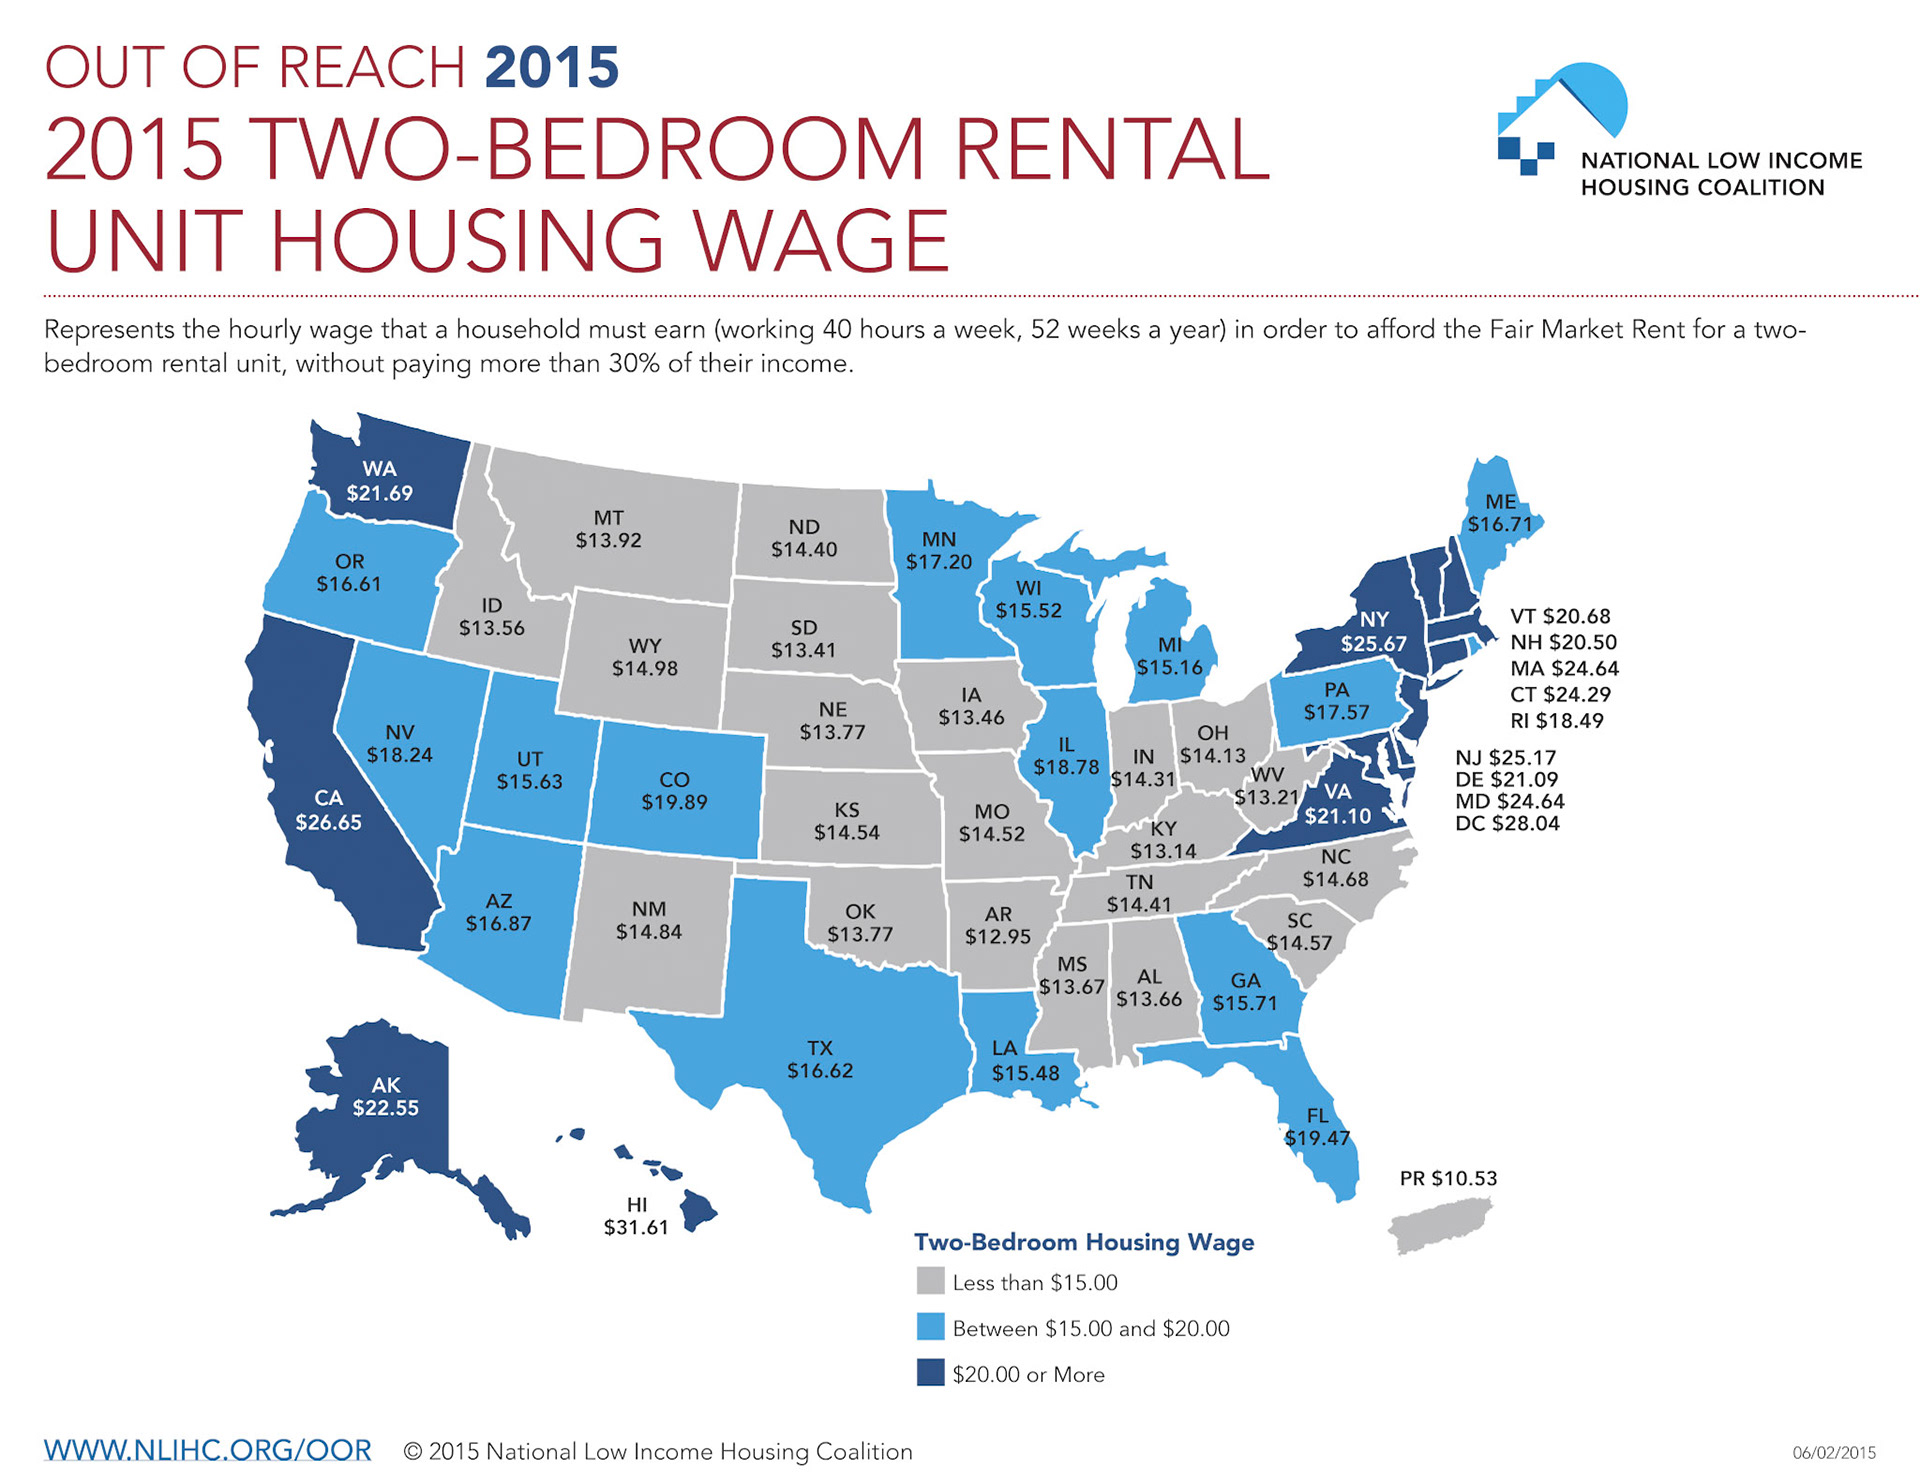
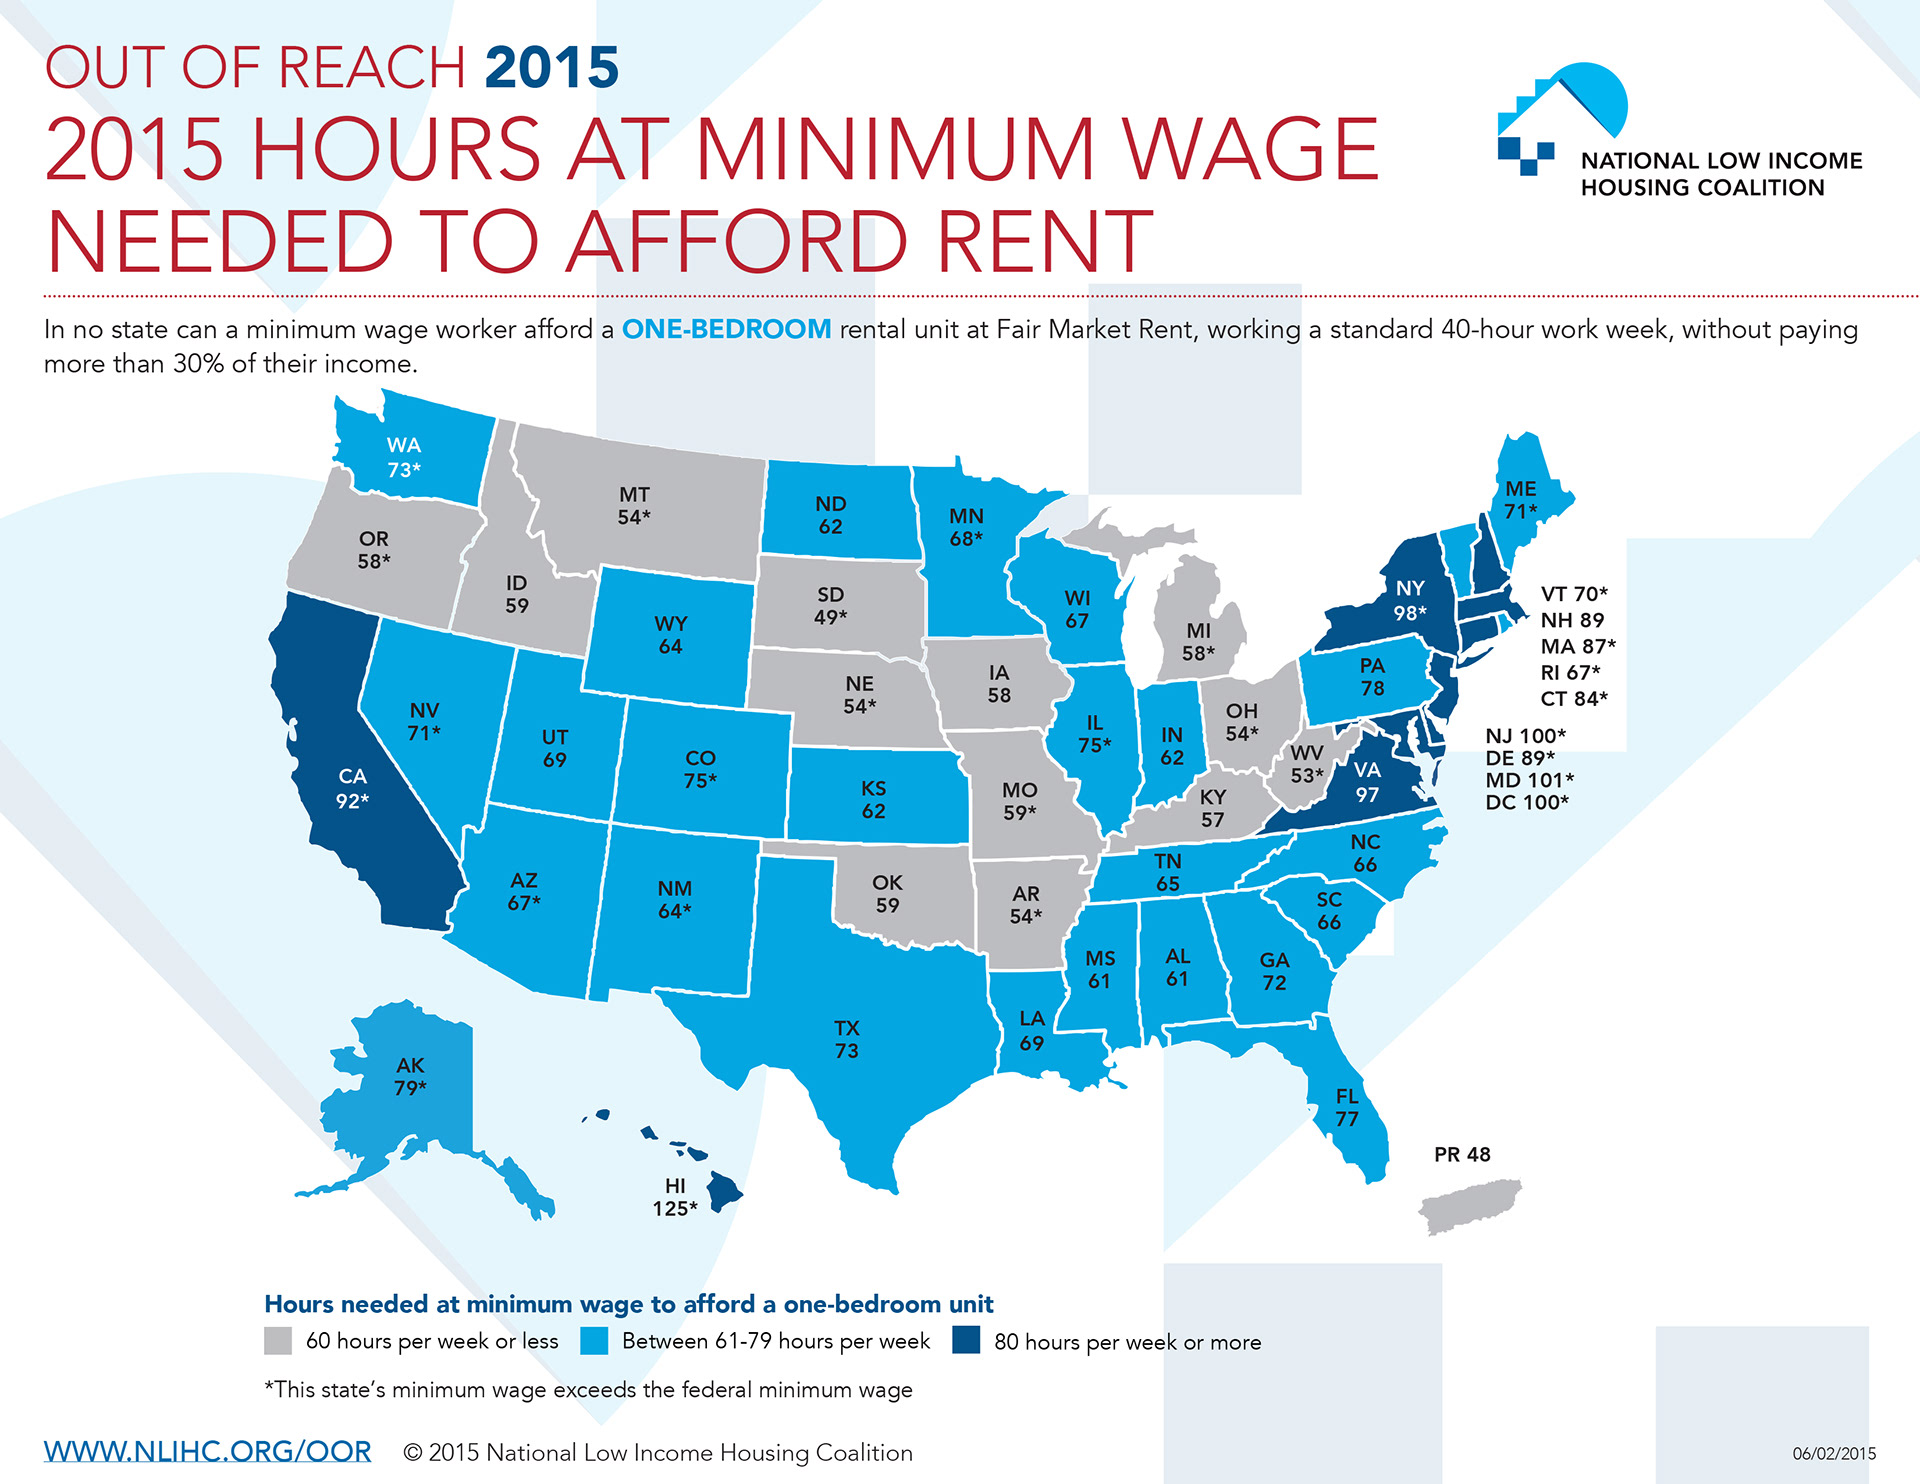
The main feature of the report is the Housing Wage Map, which shows the housing wage for each state. Also included in the report is information for each state that shows the state's ranking, other metrics for the state, and county-specific information.
The report originally was a printed report that had a PDF copy on the NLIHC website, in addition to a smaller "mini-book" that had only the front matter in it with a pocket folder on the inside back cover where state-specific handouts could be inserted. (Click on each image to view a full-size PDF or Image)
BEFORE - 2014 Out of Reach Report
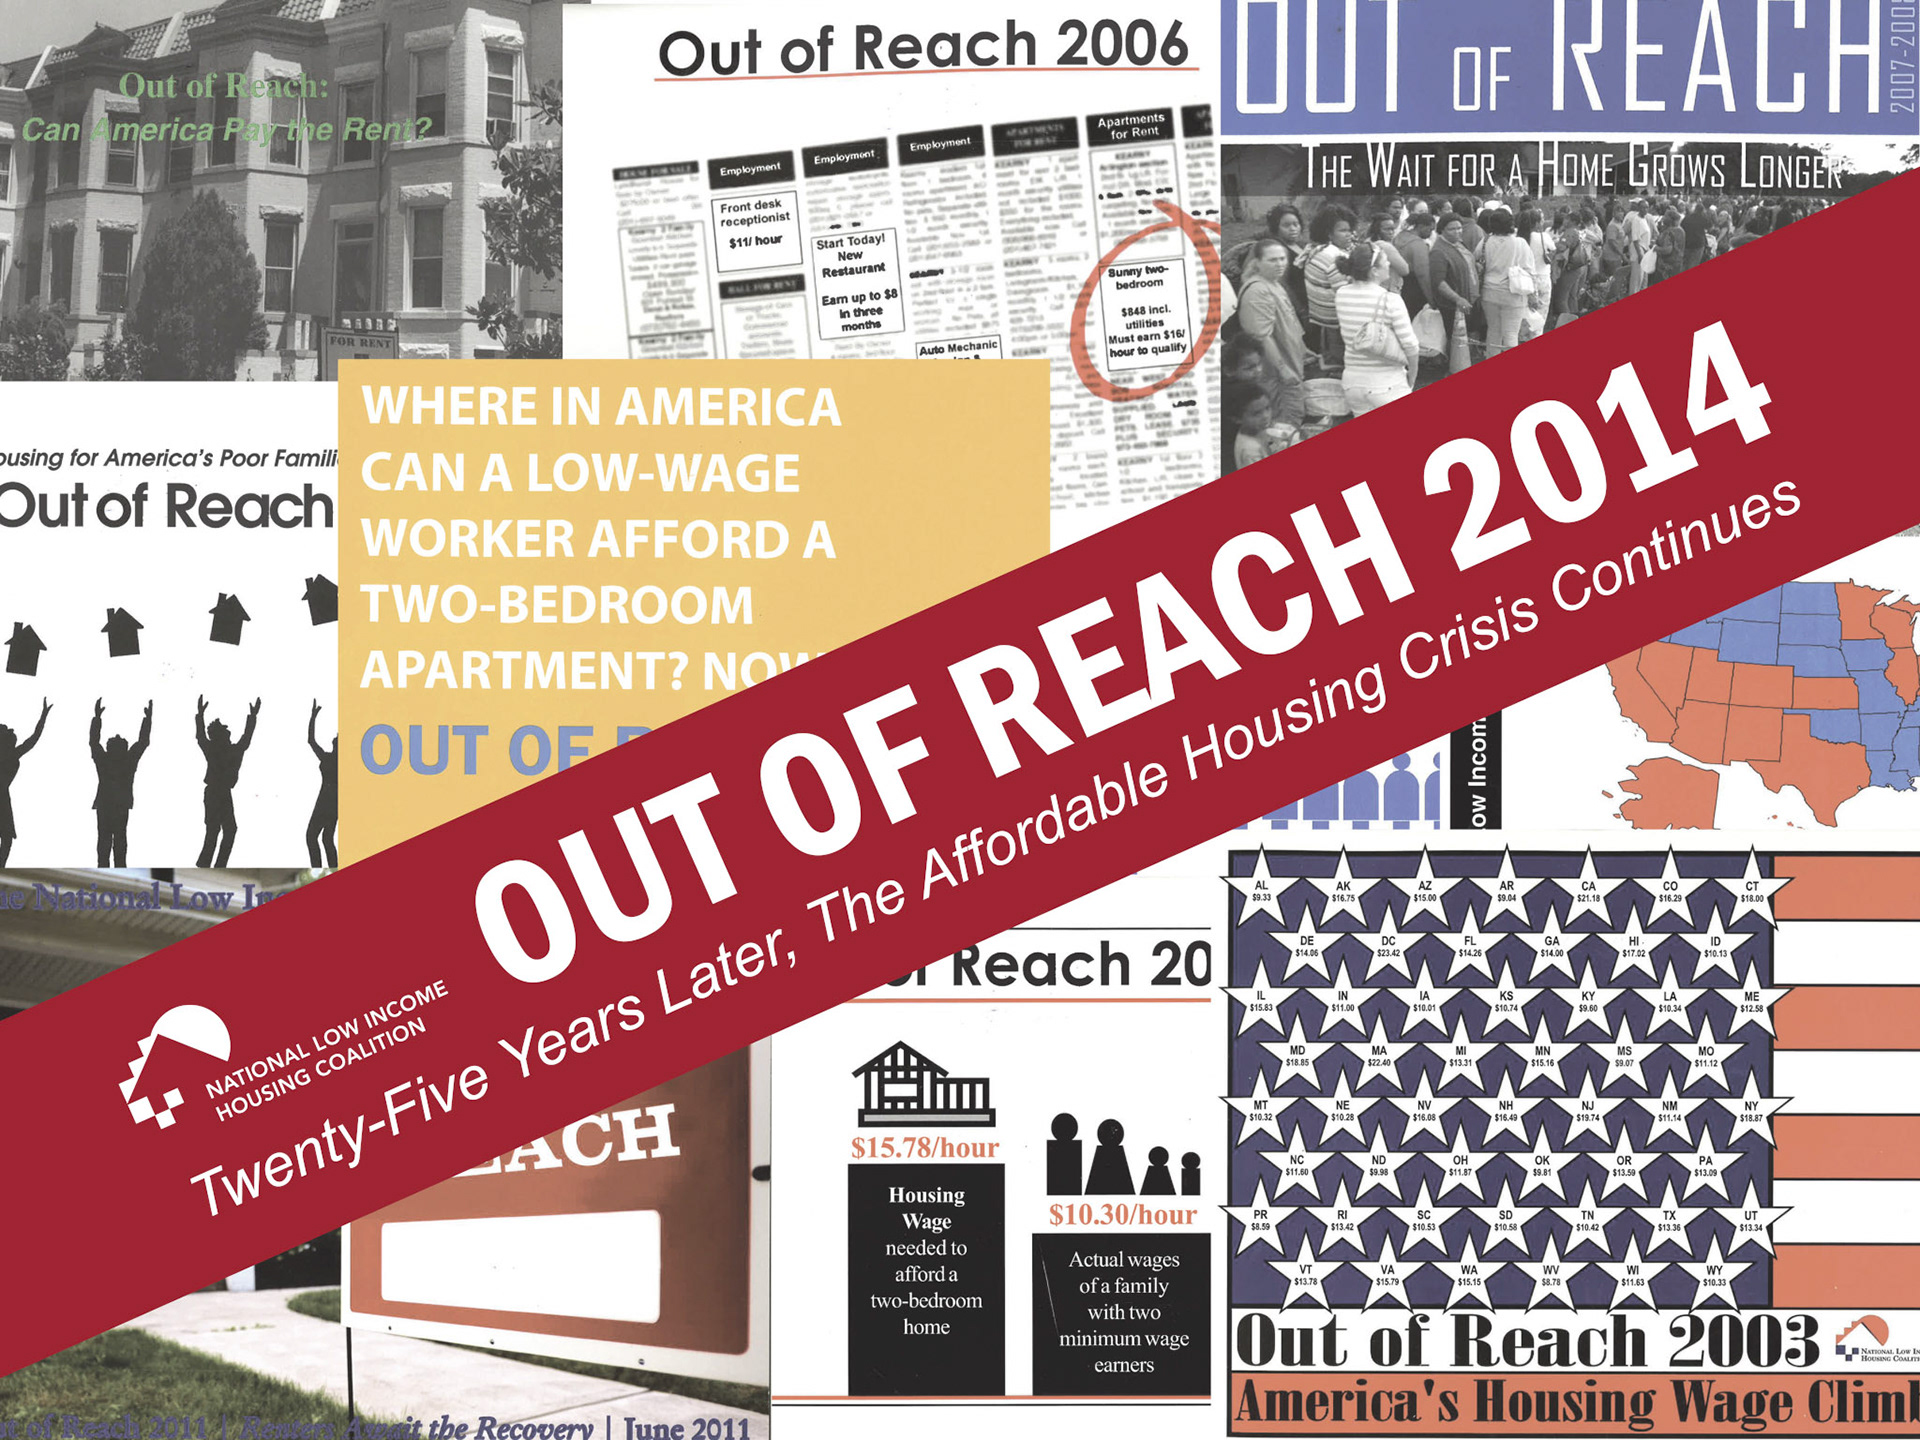
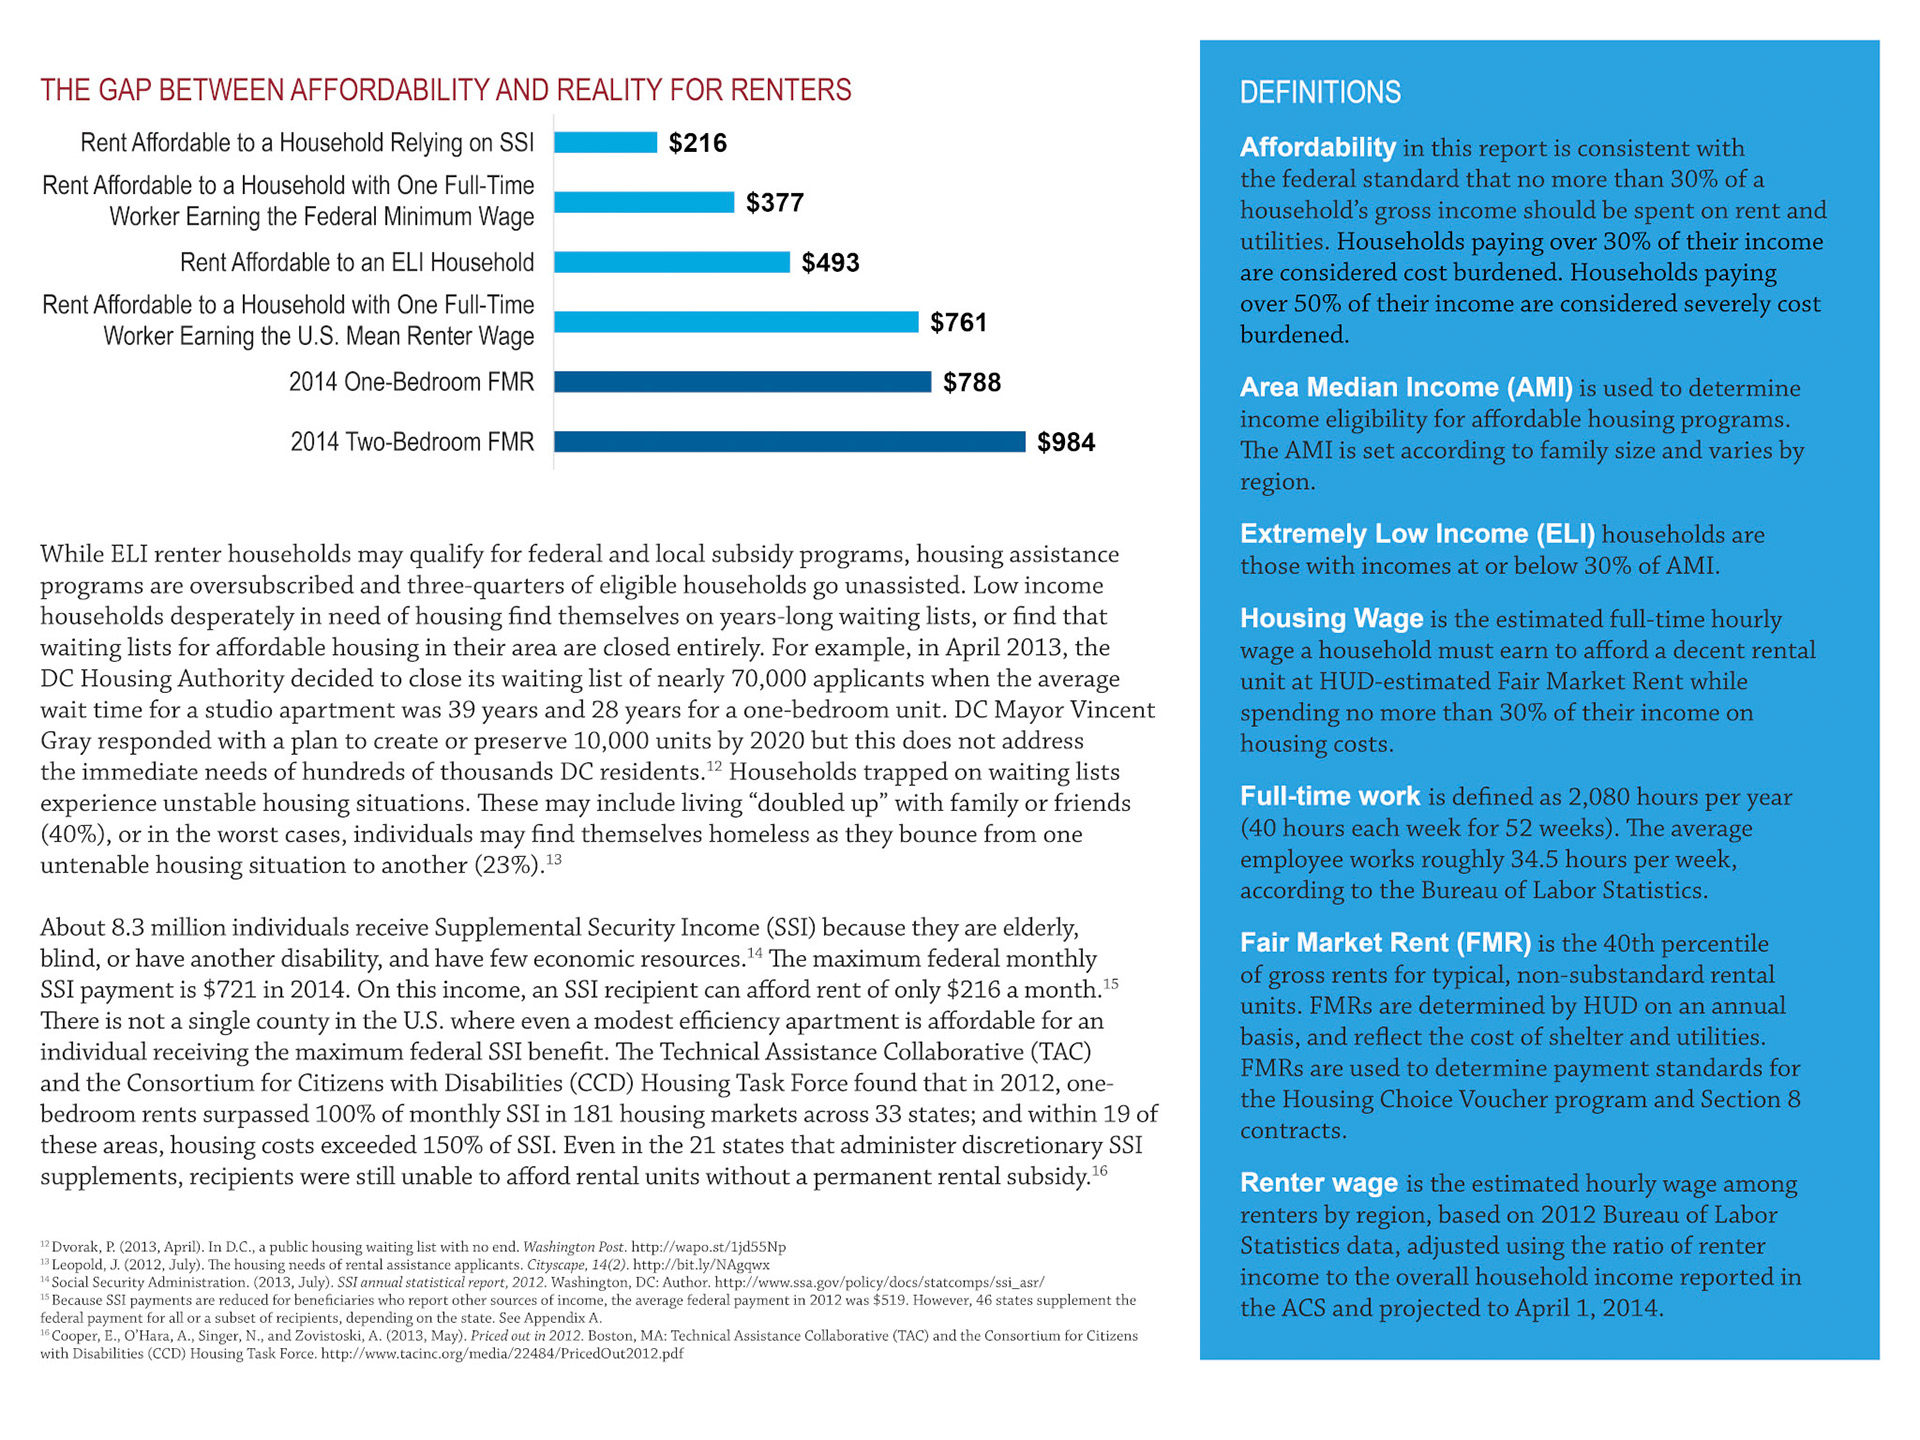
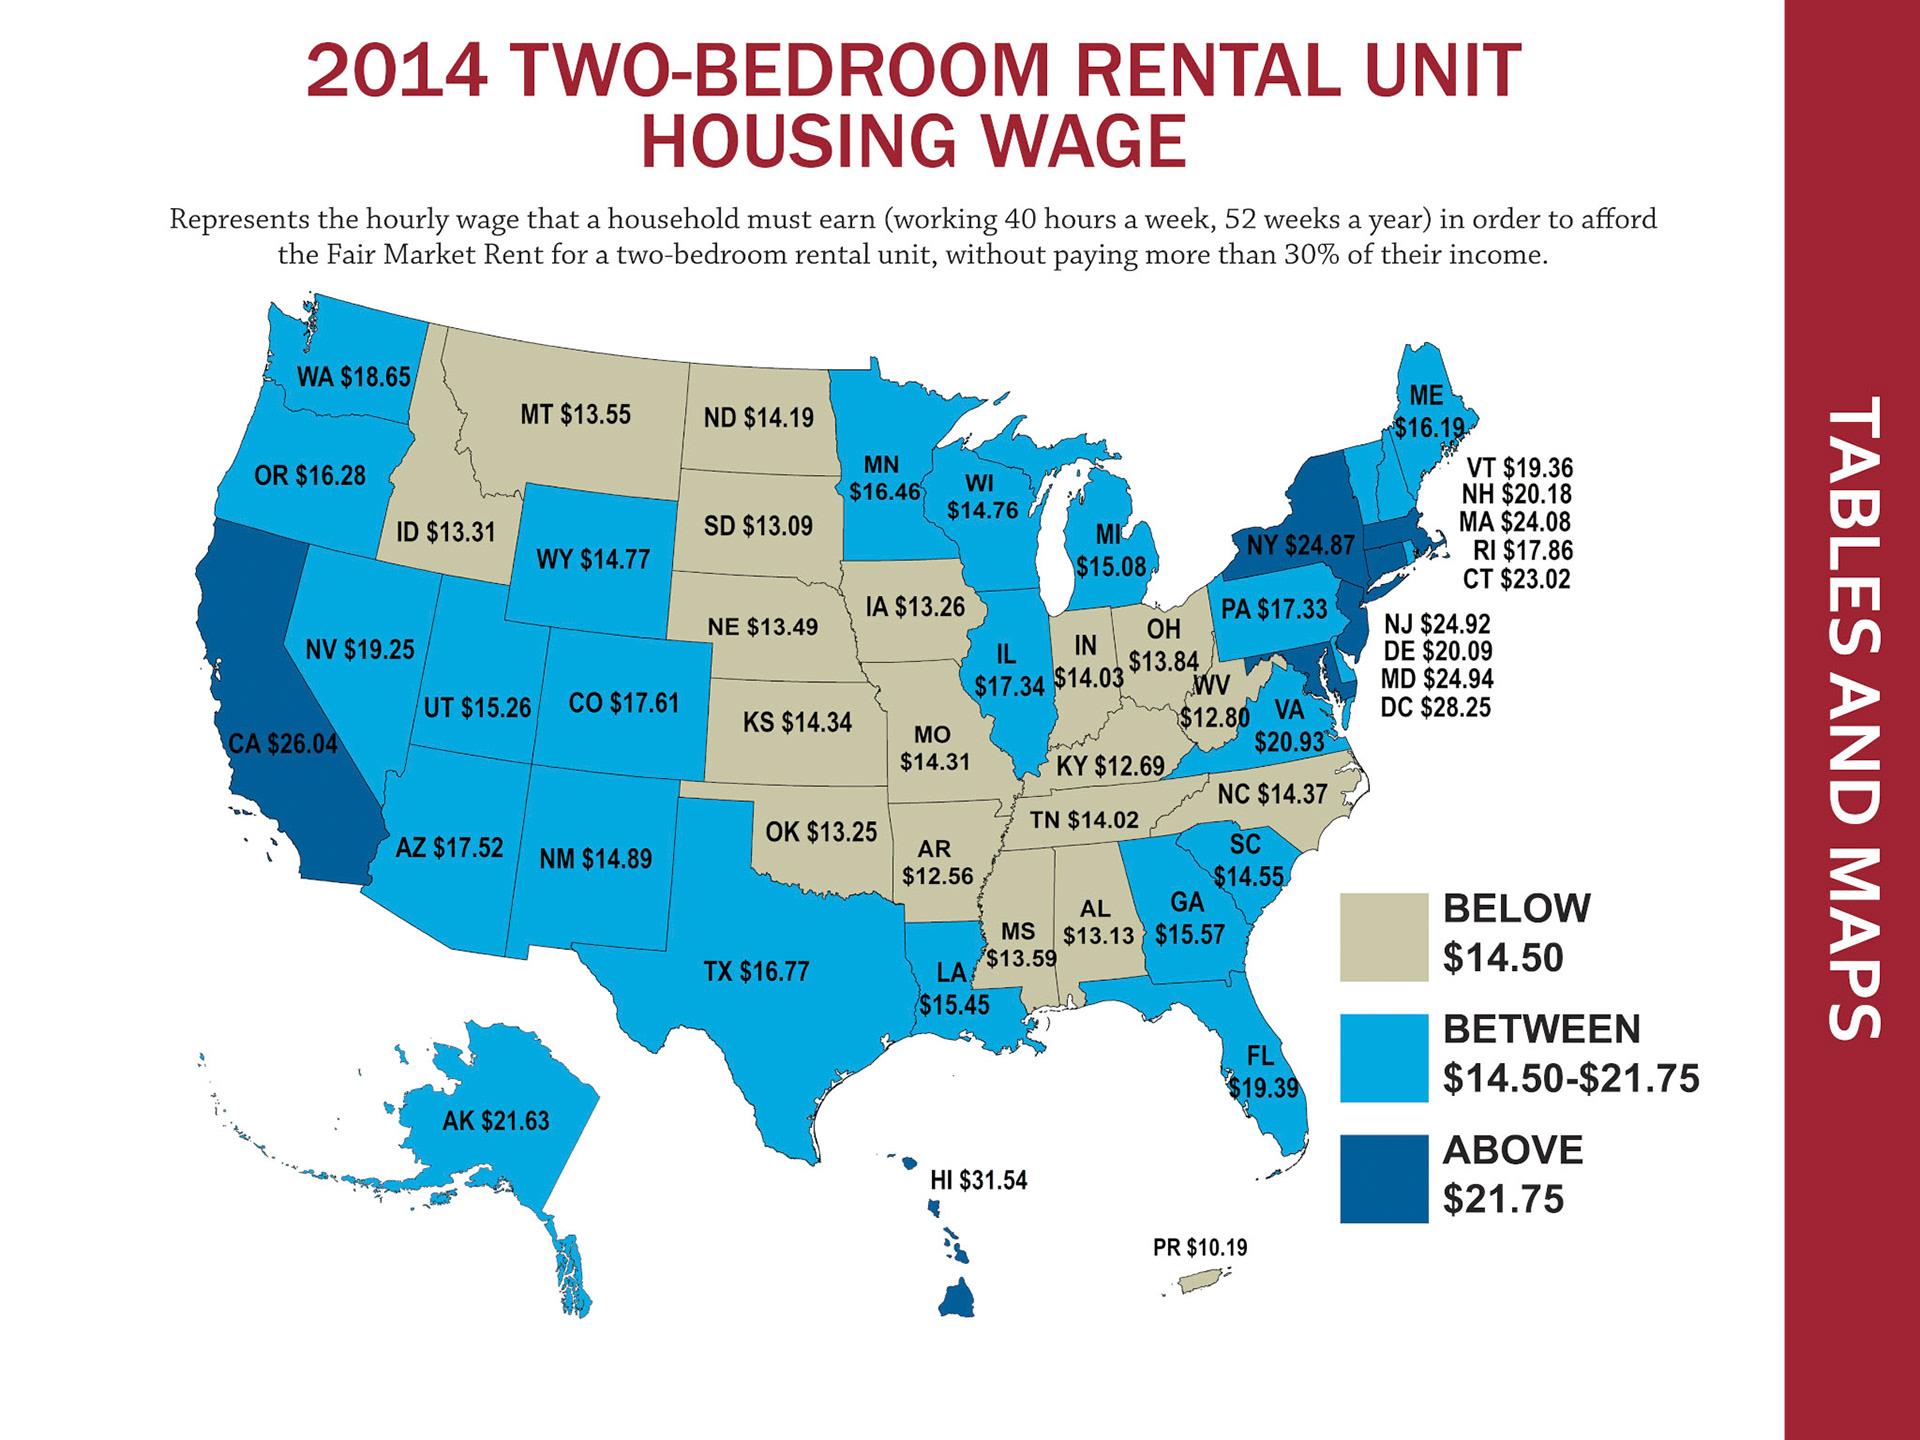
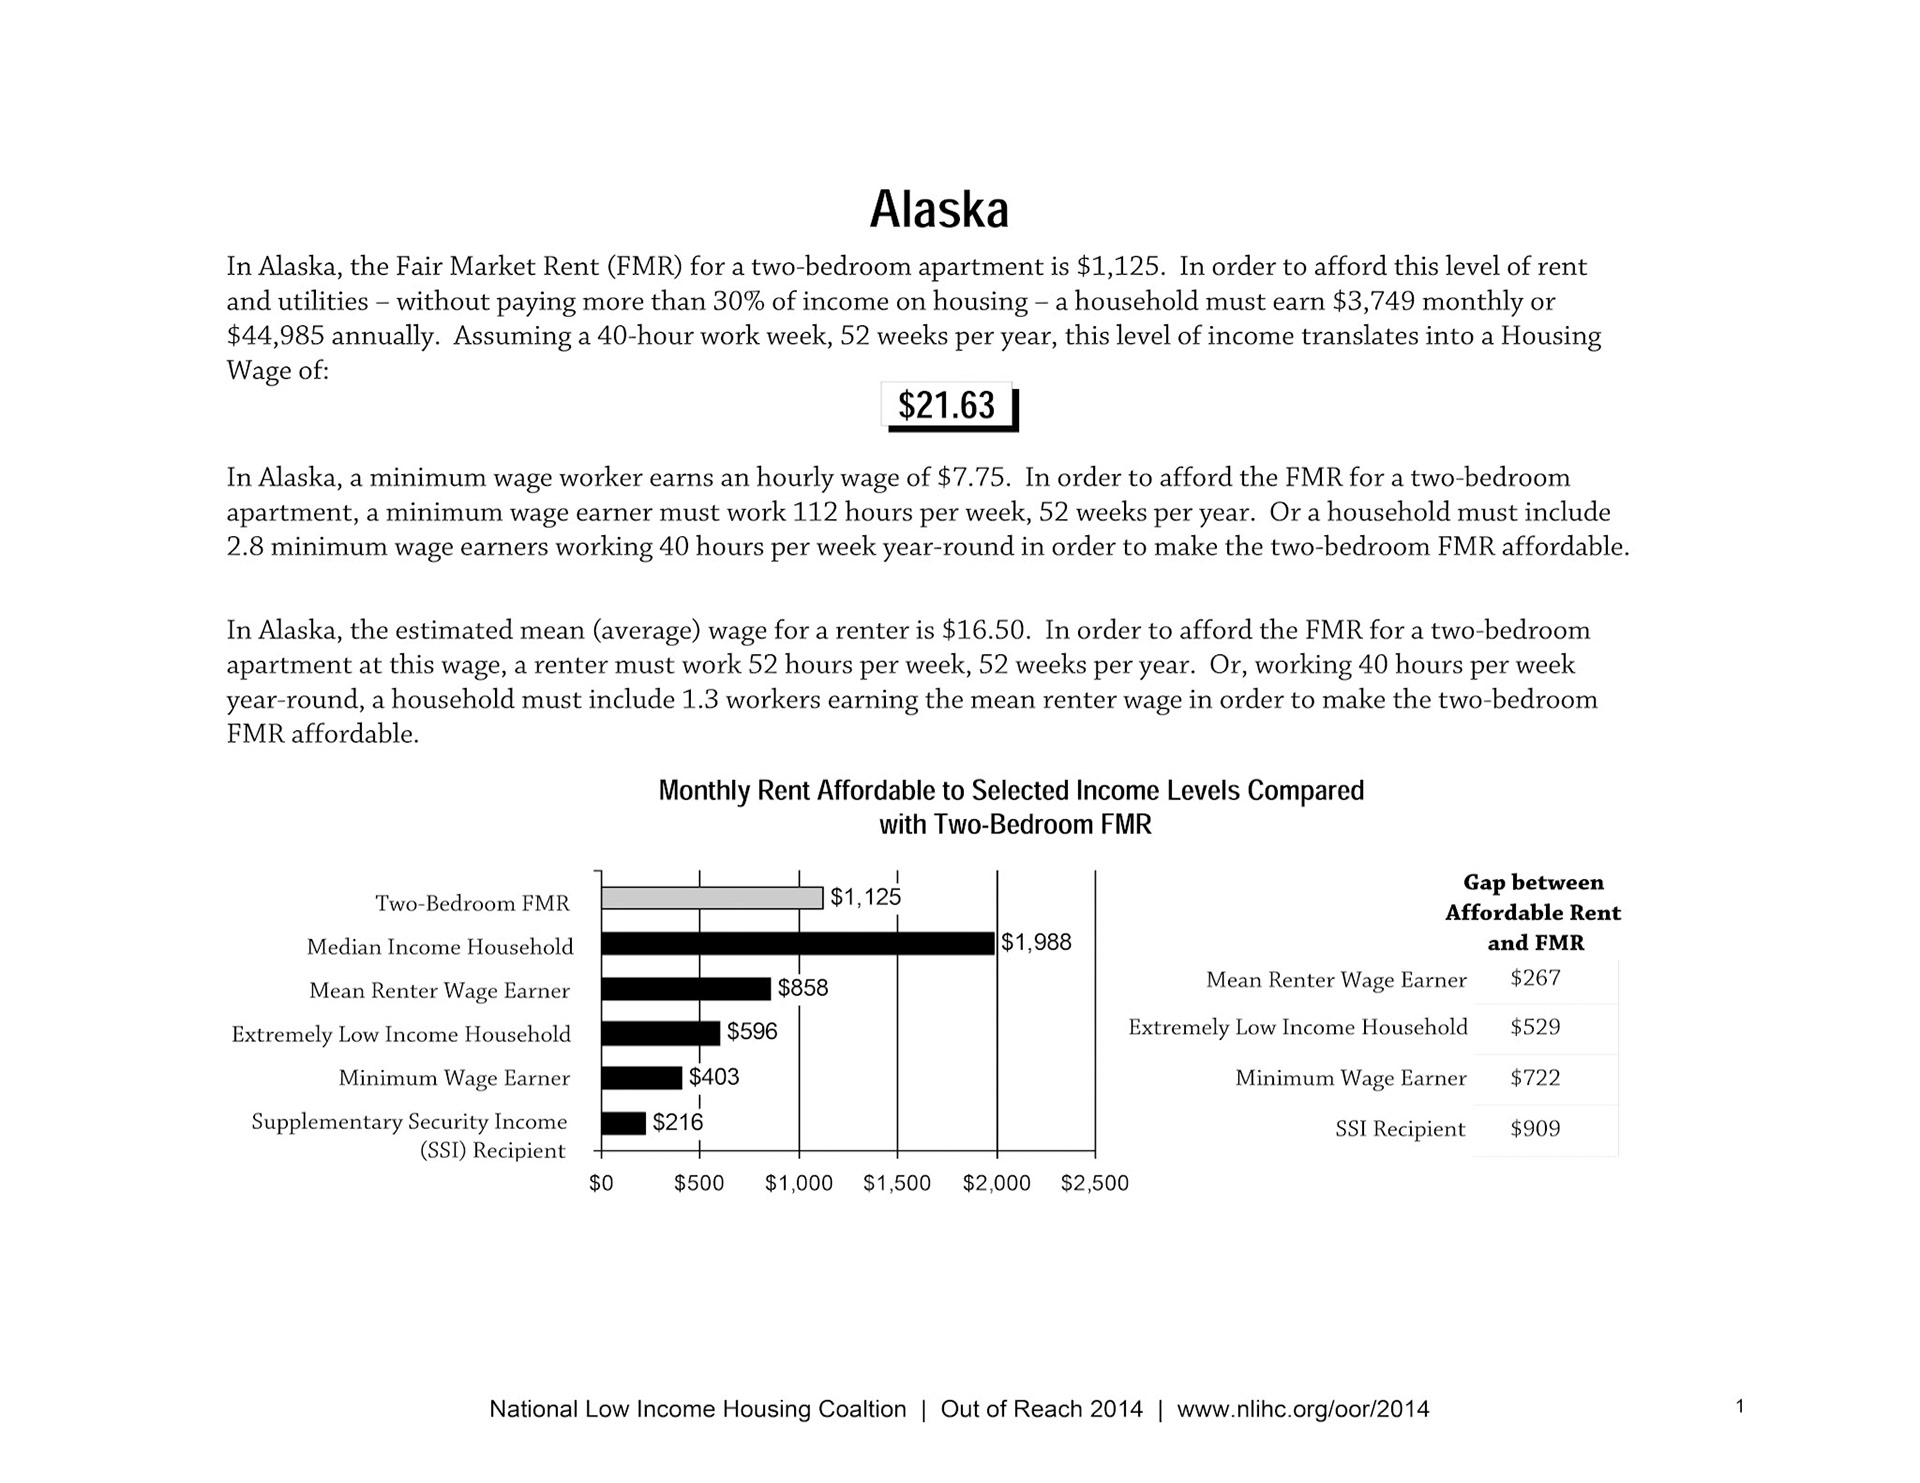
Since it was the 25th Anniversary of the report, the 2014 Out of Reach report's cover design featured covers from previous year's guides. The full report had a 4-color cover and a front section that focused on national data, and the back pages for each states were printed in black and white. The report featured charts and maps that were pulled directly from Microsoft Excel and ArcGIs. The State pages had very basic design with a small chart with state-related data and the state housing wage highlighted in a box. All of the other pertinent state data was mentioned in body text of the paragraphs and not specifically highlighted. You can view the entire 2014 report here: https://adobe.ly/2PqMfbp
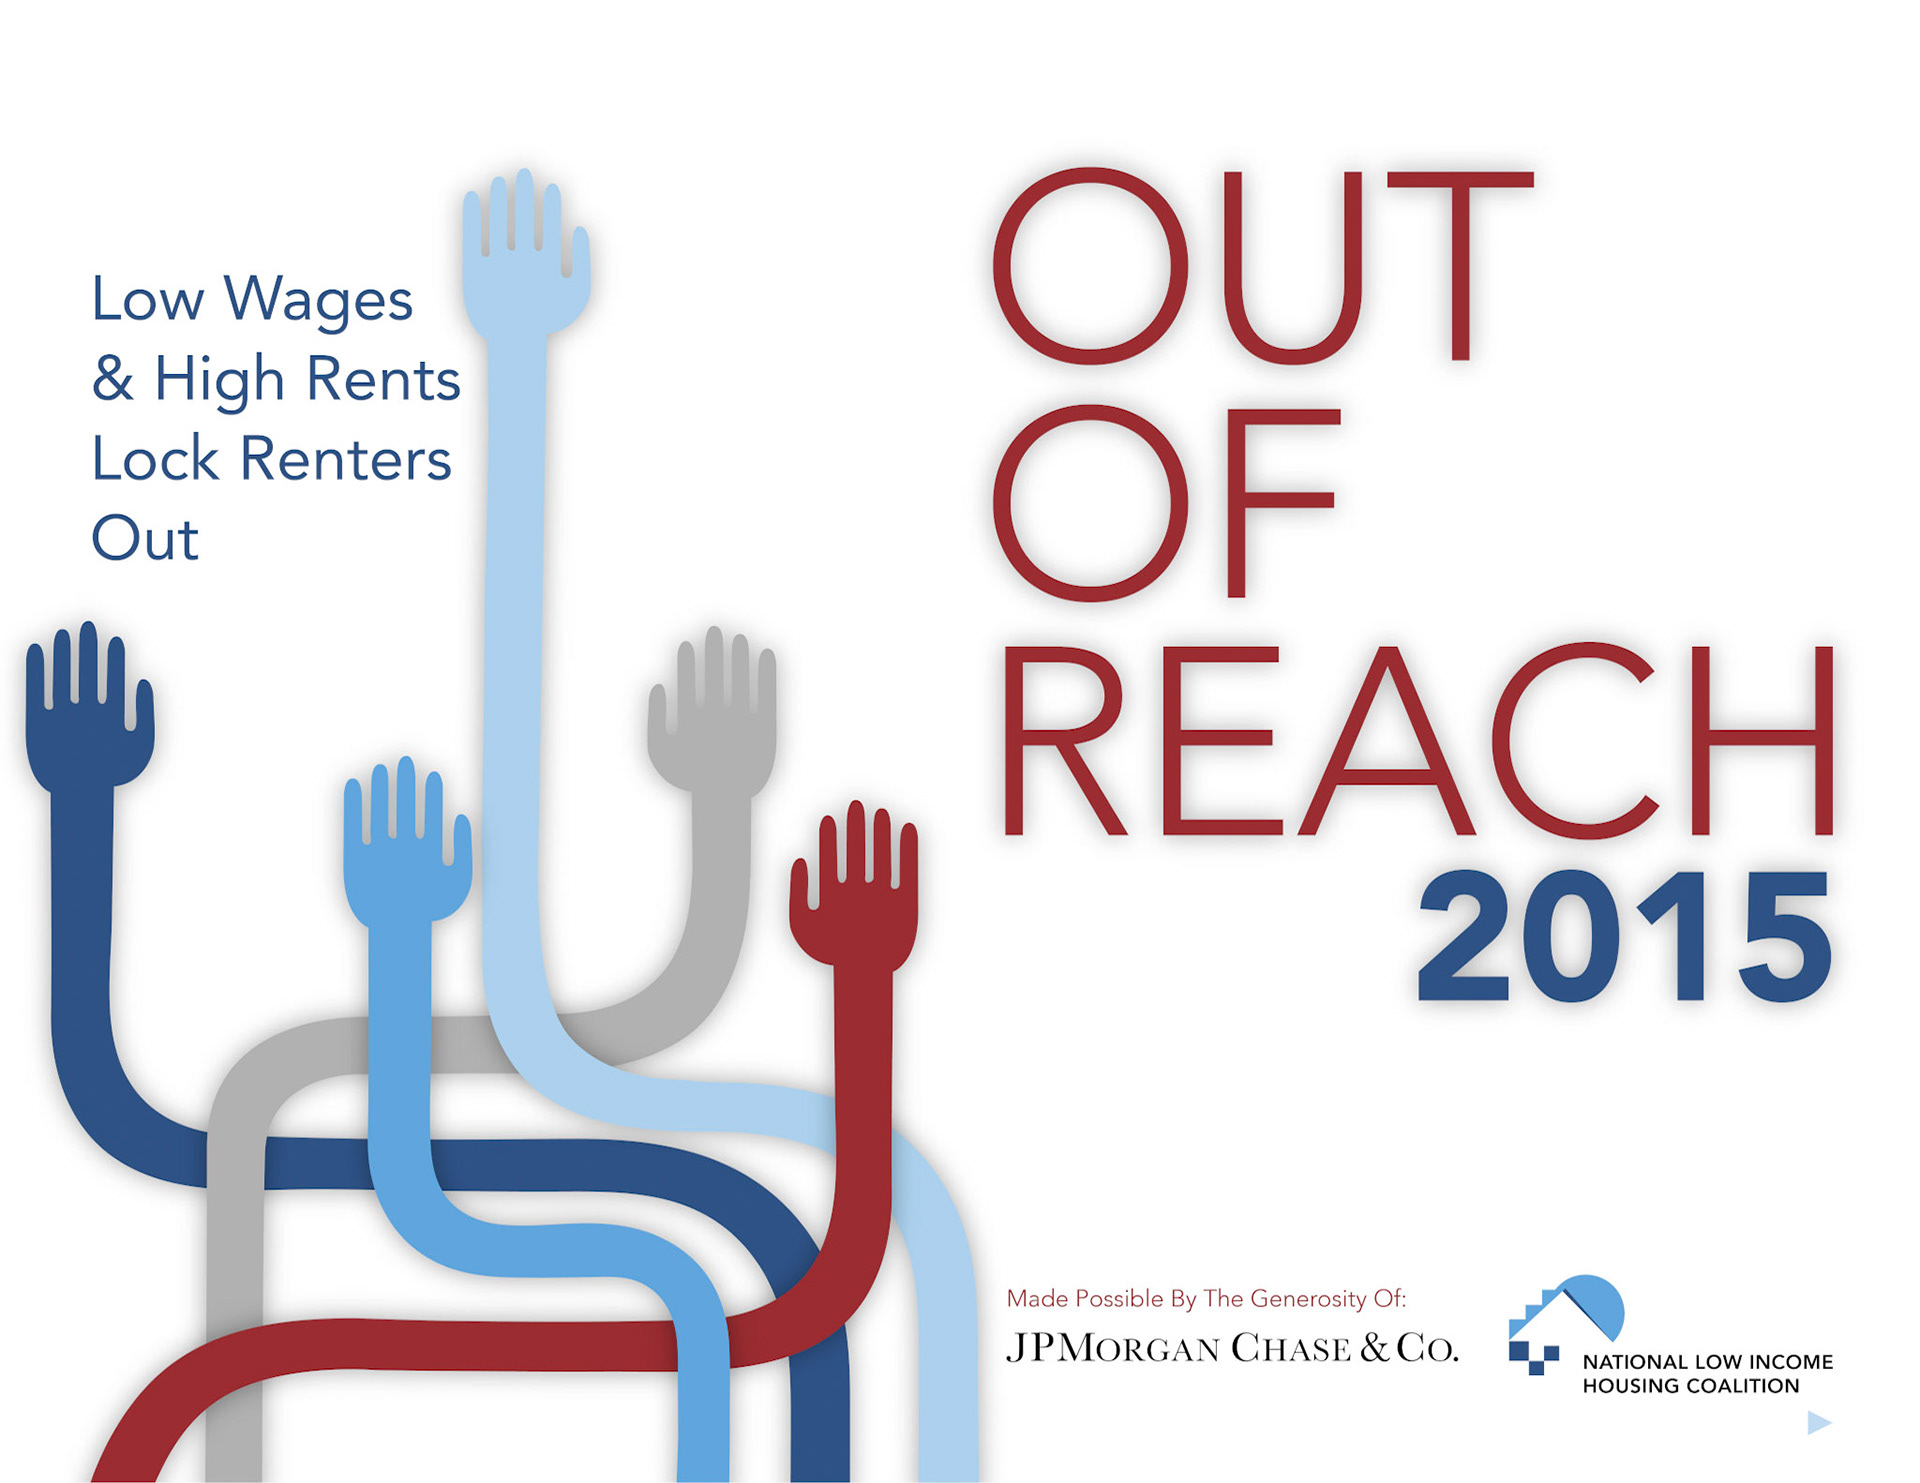
AFTER - 2015 Out of Reach Report
Changes Made:
The 2015 Edition was my first experience producing the guide and with that I implemented several changes to it. The report theme was "Low Wages and High Rents Lock Renters Out," and the cover featured different colored arms reaching up to signify how challenging it is for renters at extremely low incomes to find affordable housing. The cover also used the same typography, colors and artwork as the NLIHC brand, and like the Advocates' Guide covered featured the JP Morgan Chase logo, who annually funds the publication of Out of Reach.
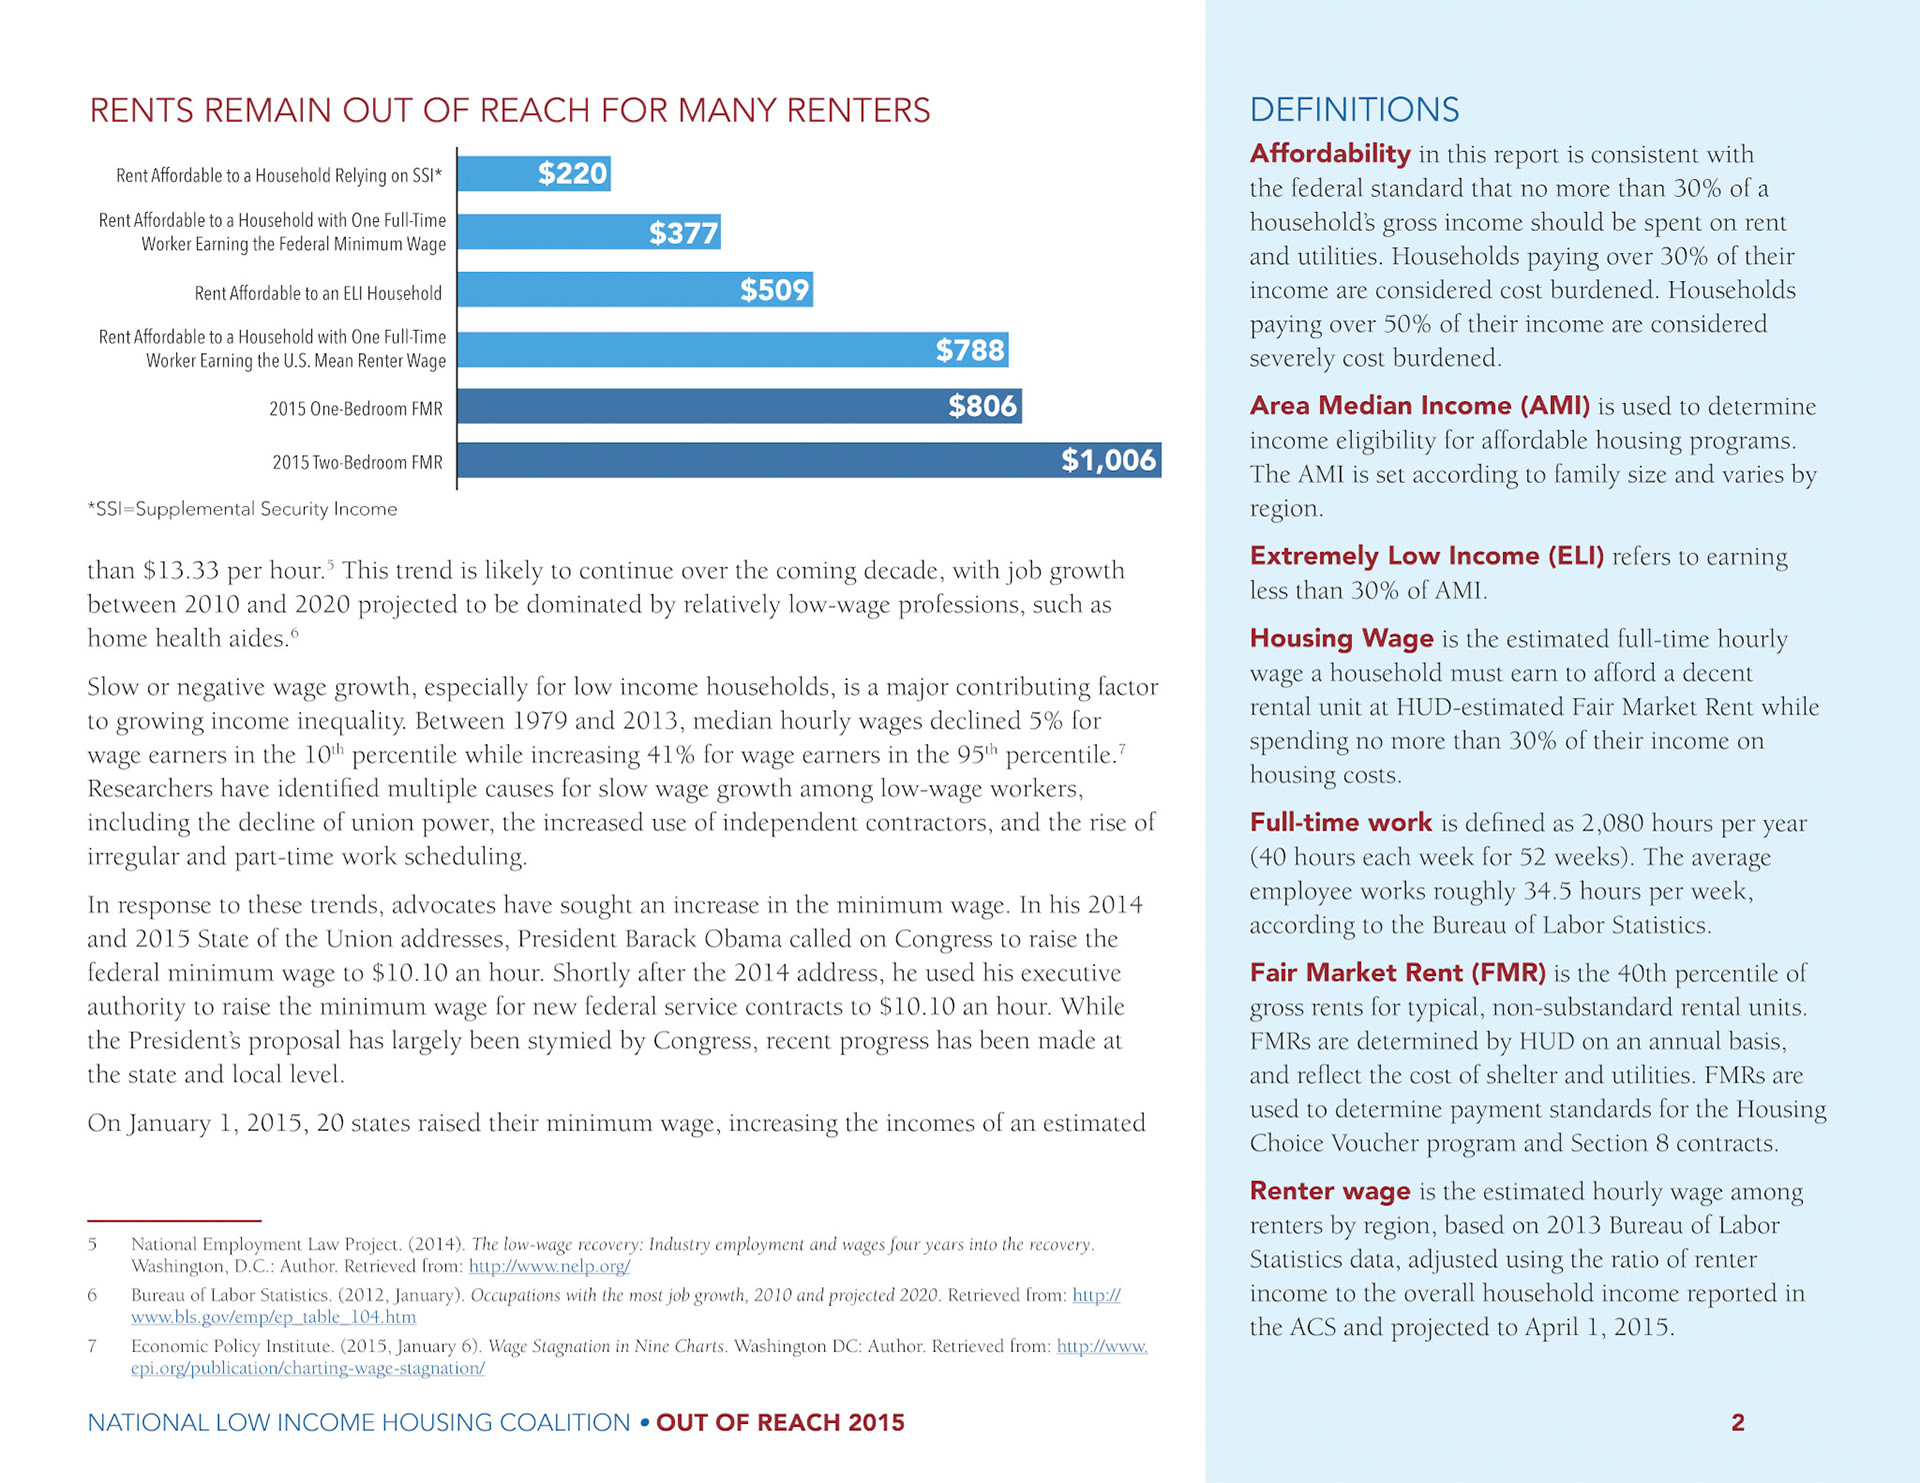
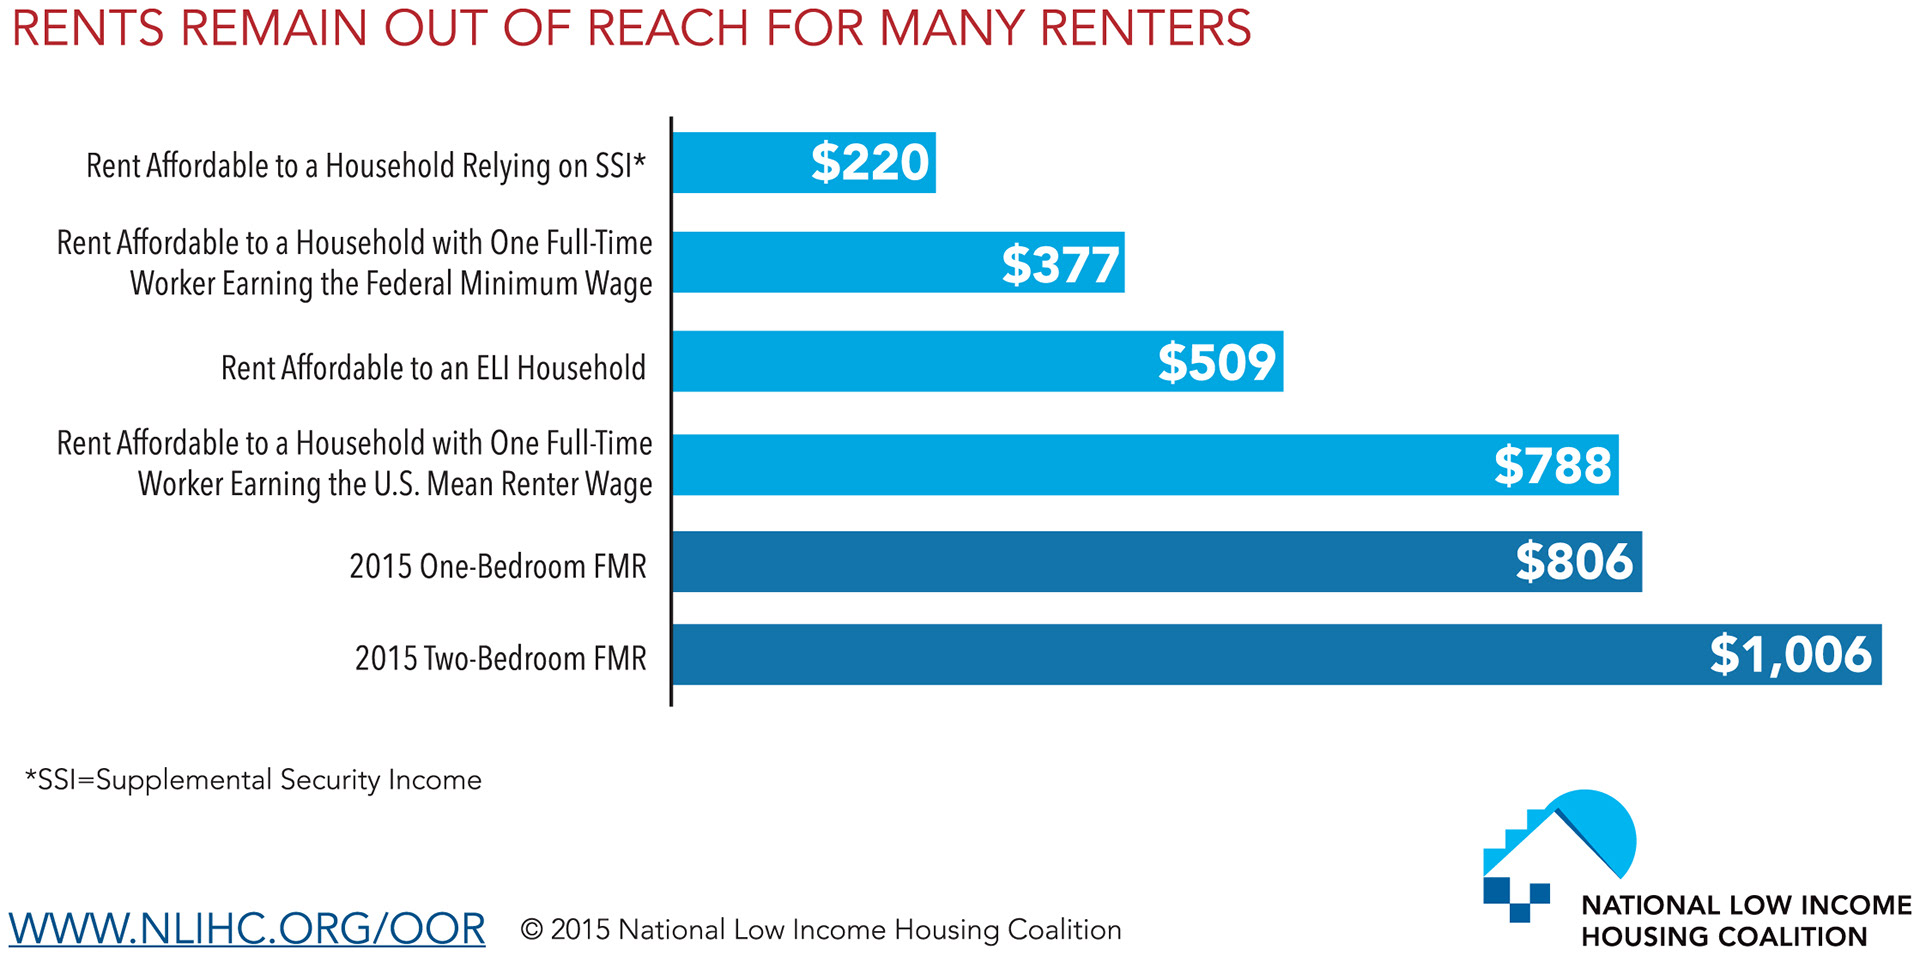
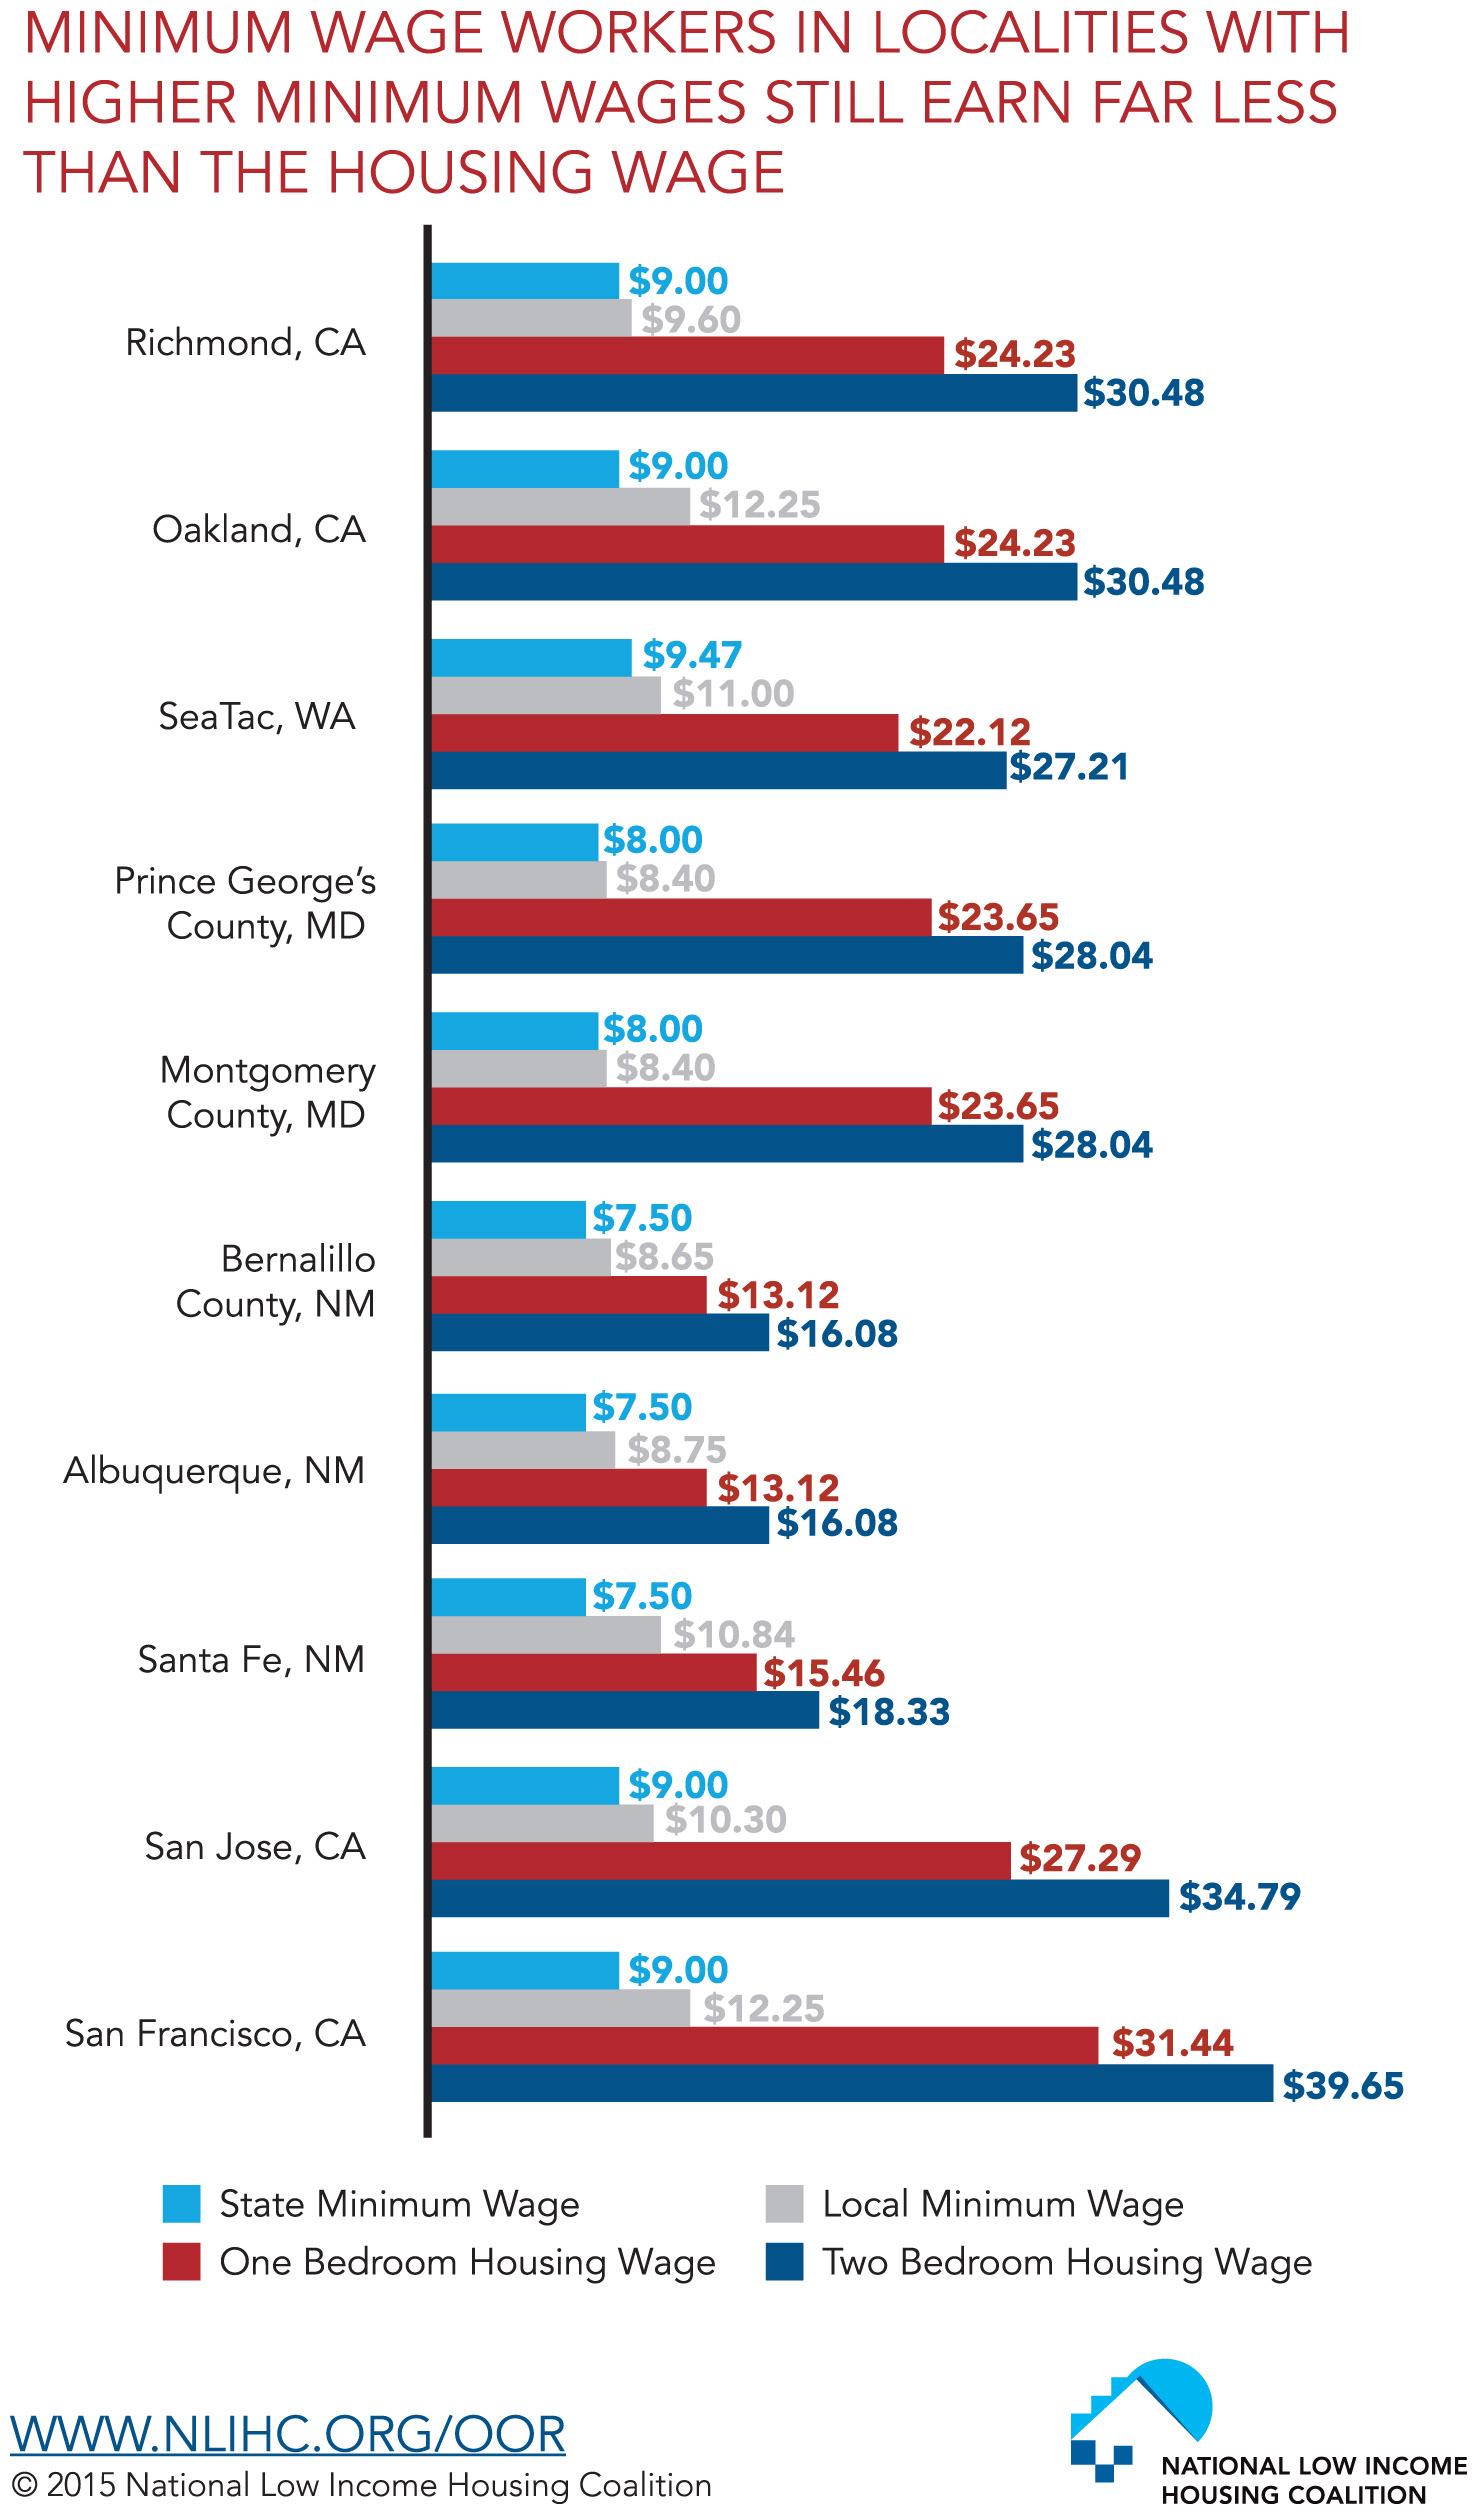
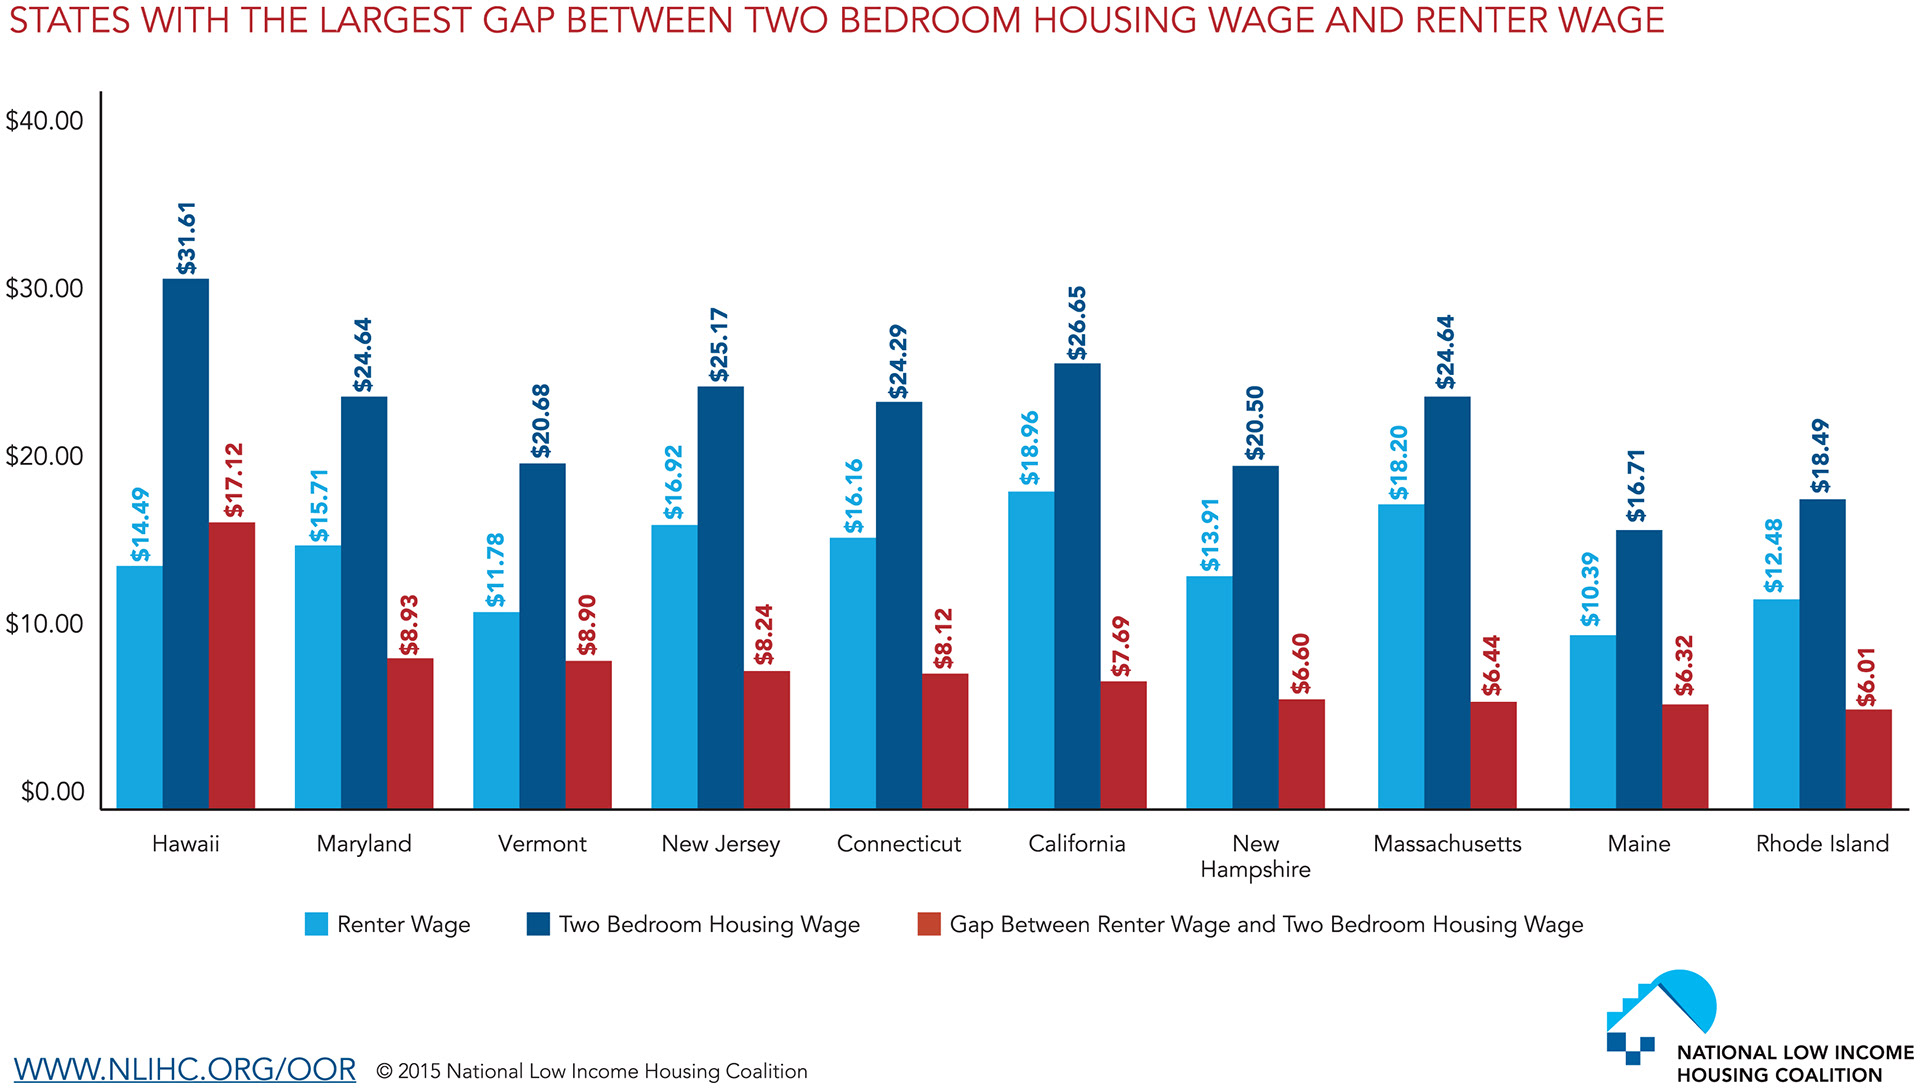
All of the charts and maps were all redesigned in Adobe Illustrator to make the data and information more impactful, while having a clean, consistent look with the NLIHC brand. A standard URL for the report, http://nlihc.org/oor was created, because this was the first year the report featured an interactive map with the state housing wages, as well as interactive state pages for users to find out their state housing wage and other state, county, and municipal data.
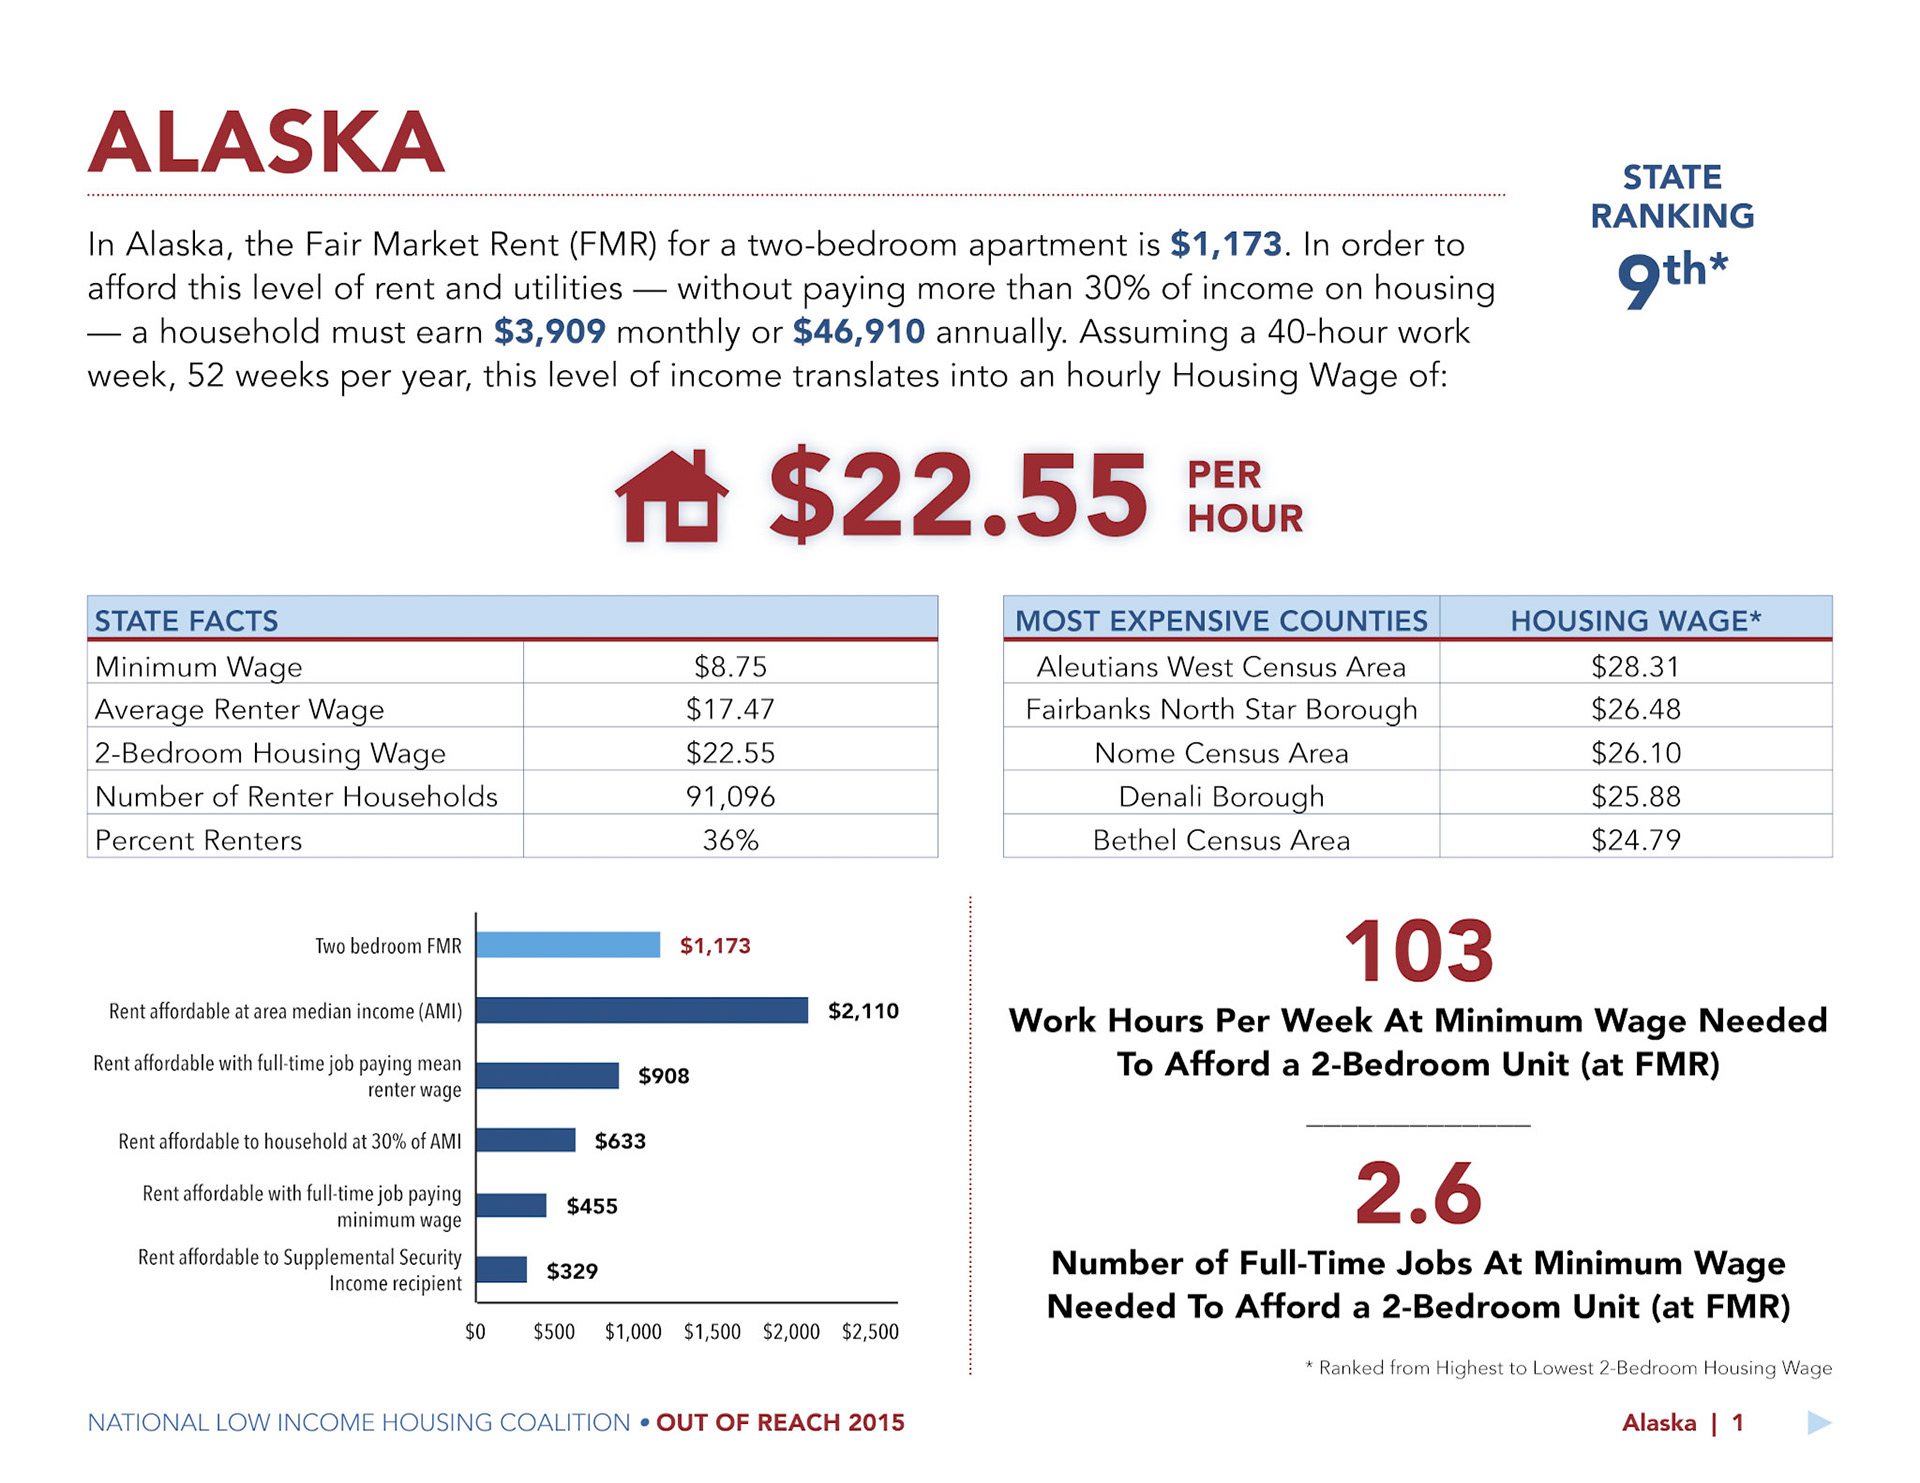
The state pages in the report were completely revamped to look more like an infographic than a page with text. Each state page had it's ranking (from highest to lowest housing) wage, and prominently featured the housing wage by using larger red text. Instead of listing some of the stats within text paragraphs, a table was used instead to highlight facts like the states' minimum wage, the percentage of renters in the state, the number of renter households, as well ad the most expensive counties/jurisdictions in the state. The bar chart highlighting the Two-Bedroom FMR and the rents affordable at different levels and different area median incomes was much larger, as was the number of work hours at minimum wage and the number of full-time jobs needed to afford a 2-Bedroom rental unit were much larger as well.
This was also the first year that a Press Kit was created that included copies of all the charts, maps and artwork in both PDF and JPEG formats that news outlets could use in print and online stories. All of the images featured the NLIHC logo, website and copyright information featured so that readers could then go to the URL http://nlihc.org/oor and see what the information is for their state.
The Result:
In the first month Out of Reach was released, the report received over 1,500 press hits, compared to the 2014 report which received 413 press hits in the first month. The 2015 report also had a total of 47,300 Twitter Impressions, compared to the 2014 report that had 29,900 Twitter impressions in the first month after the release.
You can view the 2015 Guide here: https://adobe.ly/2RI8z2b
Other Changes in Future Issues
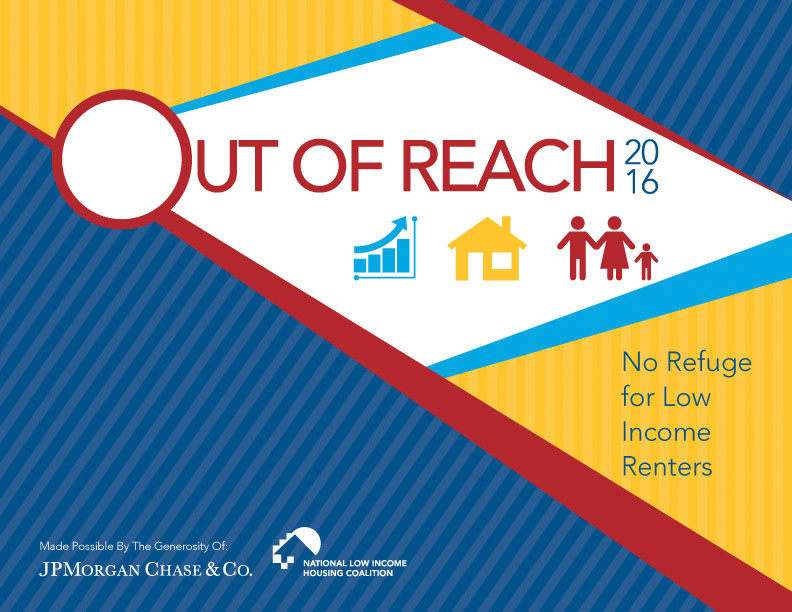
The 2016 report was expanded to include more social media outreach, which resulted in a total of 137,800 Twitter impressions in the first month, as well as a total of 2,004 media hits the first month of release. The report was picked up by even more news outlets and the report sustained repeated social media postings and articles throughout the year.
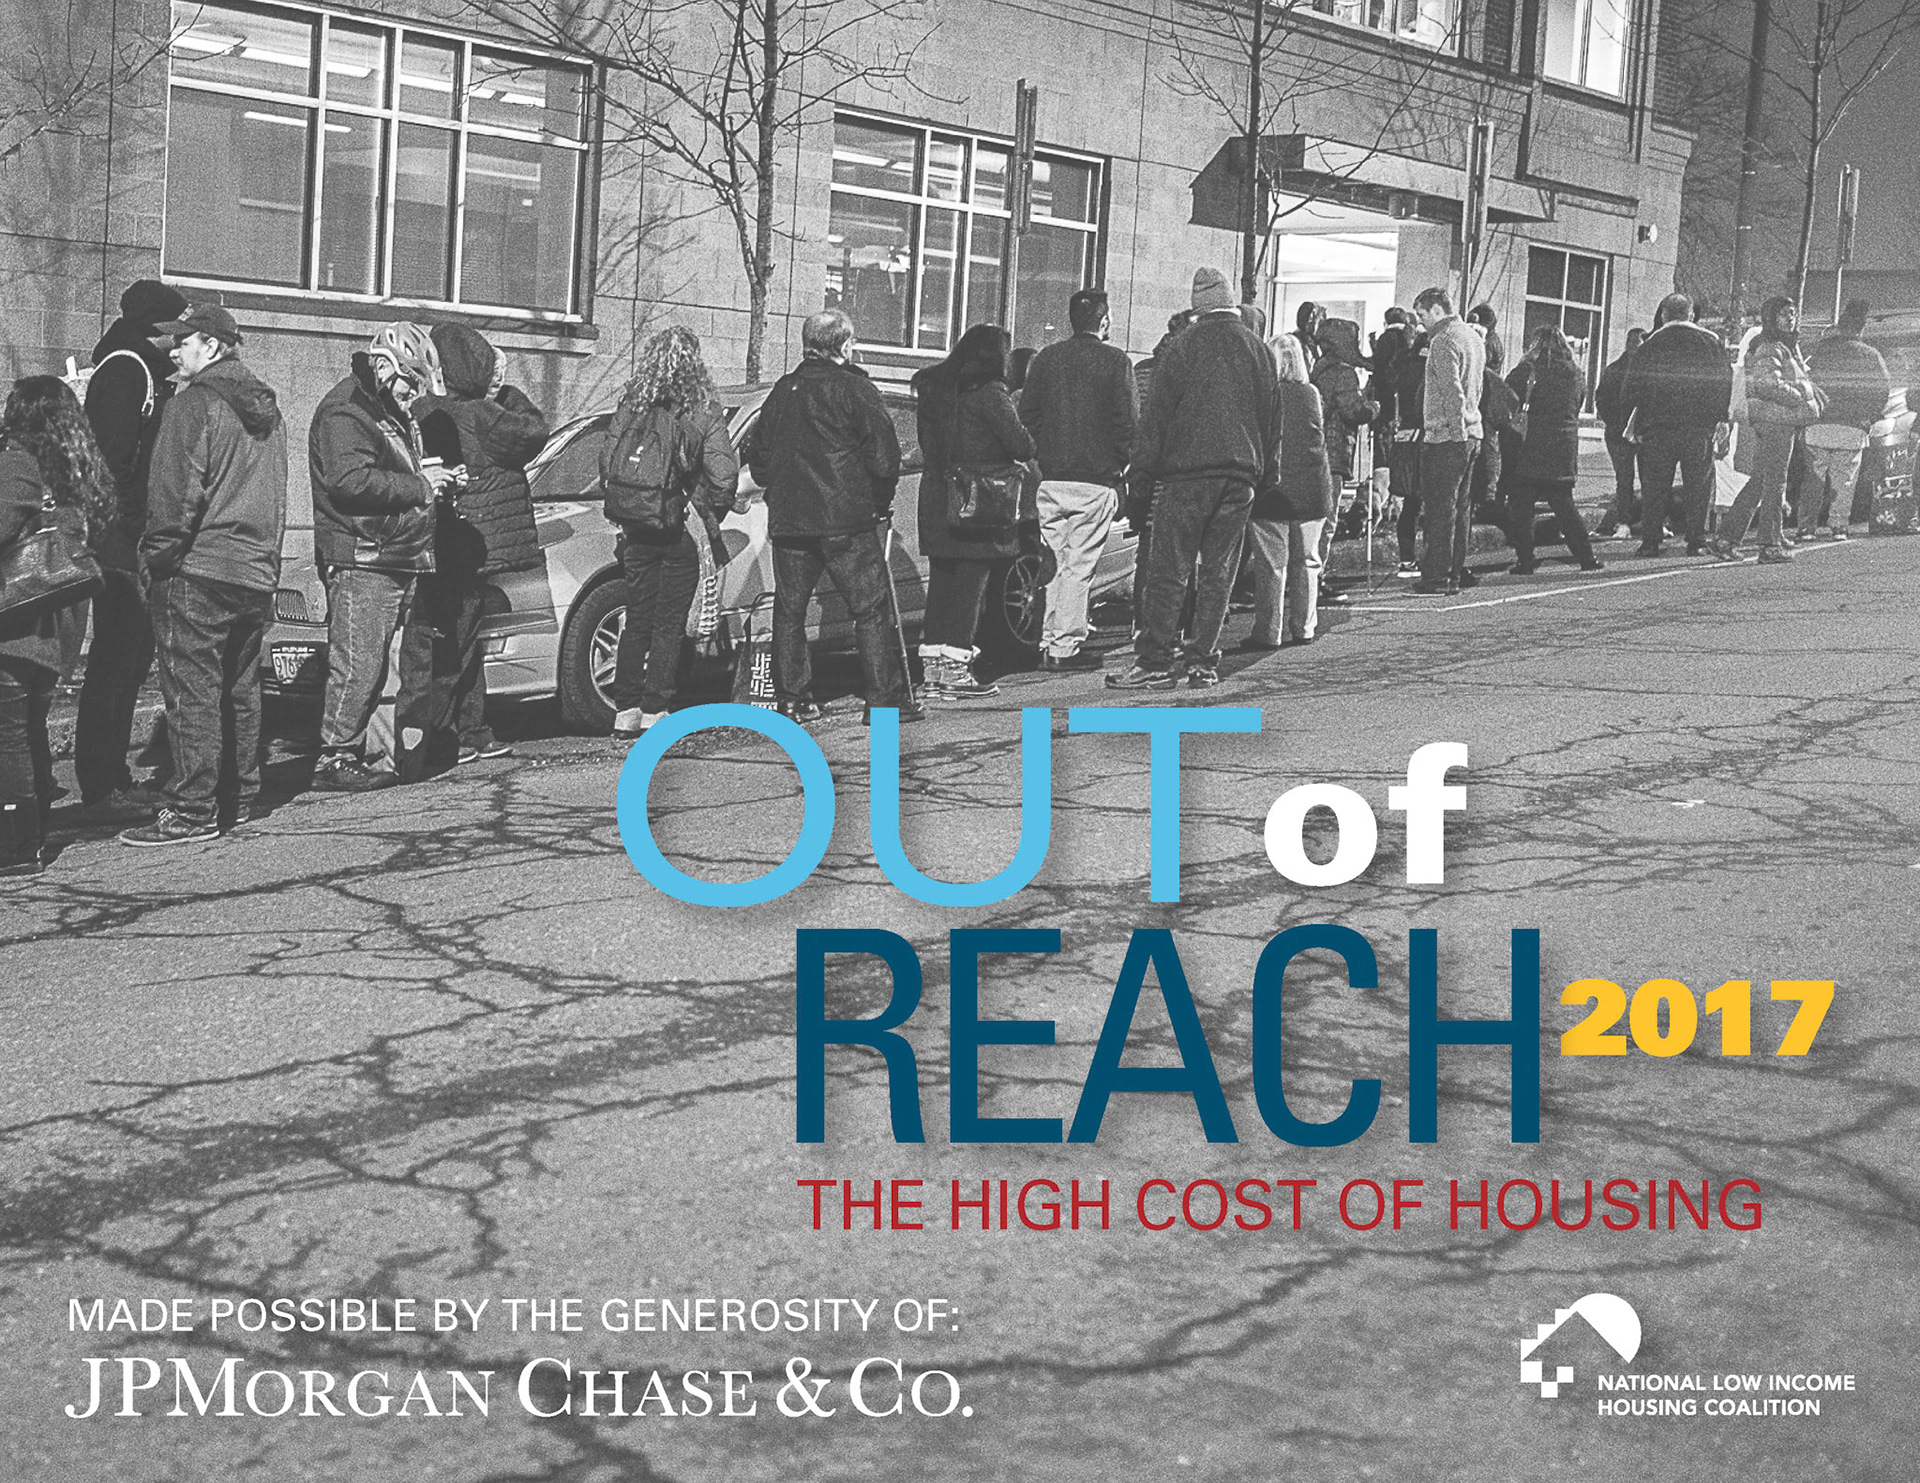
In 2017, the report was revamped to include a photo of people in line for housing vouchers in Portland, OR, to show the increasing need for more affordable housing in the united states. The state pages were also revamped to also show the number of hours at minimum wage/number of full-time jobs at minimum wage to afford a 1-Bedroom Apartment, as well as the 1-Bedroom Fair Market Rent for the State. Also in 2017, an interactive map was added where users can look up the housing wage by zip code, in addition to state and metro area. As a result, the 2017 report had total of 2,010 media hits the first month of the release, as well as at total fo 148,500 Twitter impressions the first month as well. The 2017 report was also awarded an APEX award for Design & Illustration - Design & Layout in July of 2018.
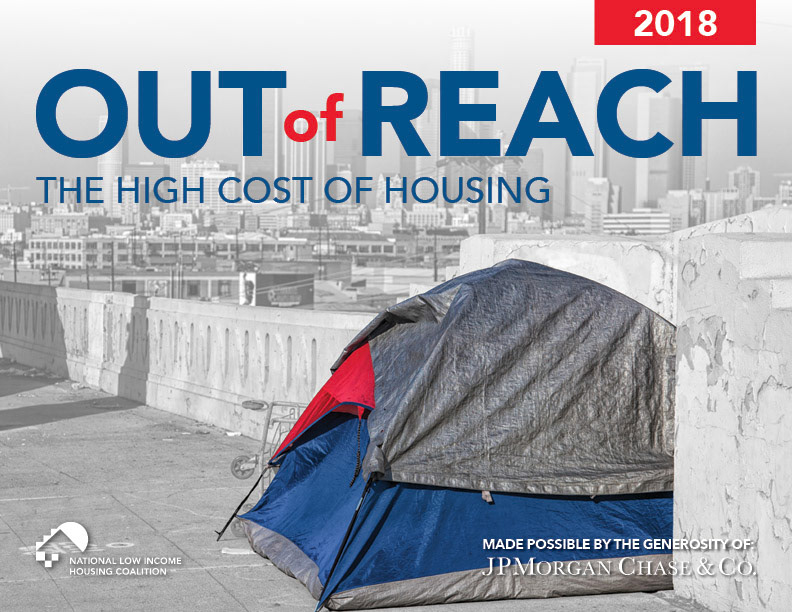
The 2018 report focused on the need for housing and how easy it is for someone to wind up homeless due to the high cost of housing and the stagnation of wages. This year's report featured more charts and graphs about funding levels for housing programs and the one and two bedroom housing wages for different wage percentiles. Also, in 2018, there was an emphasis on even more social media outreach by creating state-specific social media images that showed the housing wage and the state page infographics for sharing on Twitter, Facebook and Instagram. As a result, the 2018 report had a total of 317,000 Twitter impressions and 2,425 media hits the first month after its release.